loader image

Chart of the Week – One Major Positive & One Almighty Risk to Watch Out For in 2024

by Tim Sharp, researched by Jack Williams


One of the first events past the post of 2024 is the upcoming election in Taiwan which could have huge knock on effects for markets, the Magnificent Seven in particular

With Taiwan heading to the polling booths on Saturday 13th January 2024, perhaps the main question for inhabitants of the small independent island is how they will choose to deal with China moving forward following heightened tensions between the democratic island and those whom have laid claim to the territory.

Lai Ching-Te from the pro sovereignty party is currently the favourite amongst voters, however the opposite could be said for how he is viewed by the Chinese Communist Party (CCP) who have laid claim to Taiwan and increased both tension and activity in the straight bordering of the island in recent years.

It is worthy to note, we do not foresee an immediate military response similar to some of the nightmare scenarios being peddled by various media outlets and on social platforms, however it could have an interesting consequence for developed markets such as the US, and particularly the Magnificent Seven.

Bank of America issued a report on the 9th of January 2024 where the firm detailed its ‘Biggest Surprises to Brace for this Year’, saving the pole position for geopolitical risks to Magnificent Seven stocks and US equity markets.

The Magnificent Seven have dominated markets this year, ultimately responsible for nearly two thirds of US500 Index gains in 2023 and helping propel the Nasdaq higher by 43.4% to close out its biggest annual rise since 2020.

These well performing names are not without risk, and it is their concentration and correlation which becomes problematic. All of the Magnificent Seven names rely heavily on Taiwan for it’s business. Companies such as Amazon, Apple, and star of the market last year, Nvidia (+234% LTM) are all super exposed to Taiwanese Semiconductor manufacturing companies such as TSMC whom build their next generation chips needed.

This overdependence has seen stock concentration between the Magnificent Seven and Taiwanese manufacturers such as TSMC rise to an all-time high of 66%. This concentration poses significant risks, amplifying vulnerabilities in the supply chain and potentially impacting wider technology markets.


Figure 1 – Correlation of MAG7 to TSMC Reaches ATH of 66% (Bloomberg)


With the Magnificent Seven also currently holding a record share of the US market (not helped by market cap weighted indices) this leaves the entire US stock marker severely responsive to any complications to the supply of semiconductors

Figure 2-Mag Seven MCap Compared to Nations (Source: Factset)

To emphasise the scale of this concentration within markets the Magnificent Seven’s combined Market Cap eclipses the stock market capitalisation of Canada, Japan and the U.K….Combined!

But it is not all doom and gloom! Over the past 90 days Wall St analysts have cut their targets for Q4 2023 earning estimates by far more than usual for this period, meaning a lower bar than expected could be in place and a potential surprise to markets further down the line.

With wider acceptance that the rally towards the end of last year resulted from premature excitement surrounding rate cuts in 2024, not as a result of accelerating corporate fundamentals, this leaves the prospect of a corporate recovery still on the table.

With analysts having cut earnings estimates for the US500 Blue Chip index by around 6% since early October, Edward Yardeni of Yardeni Research sees it as perhaps overdone and sees corporates in much healthier positions, setting his EPS estimate for 2024 US500 at $270, up $26.40 from the $244.60 EPS from last year.

Table 3-US 500 Returns Around End Of Fed Hiking Cycles (Goldman Sachs)


References:

www.zerohedge.com. (2024.) The Market Ear. Front running the ‘low bar’ | Zero Hedge. 09/01/2024 [online] Available at: https://www.zerohedge.com/the-market-ear/front-running-low-bar

Authers, J. (2024). Bloomberg News Magnificent Seven Risk Runs Through TSMC. [online] www.bloomberg.com. Available at: https://www.bloomberg.com/opinion/articles/2024-01-10/magnificent-seven-risk-runs-through-tsmc-and-taiwan-s-election

Lee, I. (n.d.). Bloomberg – Magnificent Seven’ Warning, IPO Return Among BofA’s 10 Surprises on Wall Street. [online] www.bloomberg.com. Available at: https://www.bloomberg.com/news/articles/2024-01-09/bofa-warns-on-magnificent-seven-in-10-surprises-on-wall-street?srnd=undefined

Liu, E. (n.d.). The Magnificent 7 Are Larger Than Entire Countries’ Stock Market. [online] www.barrons.com. Available at: https://www.barrons.com/amp/articles/apple-tesla-nvidia-magnificent-seven-stock-market-8d355cb3

Fox, M. (n.d.). Here’s a complete rundown of Wall Street’s 2024 stock market predictions. [online] Markets Insider. Available at: https://markets.businessinsider.com/news/stocks/2024-stock-market-investment-outlooks-wall-street-prediction-roundup-sp500-2023-11

Hottinger Appoints New Chair

Hottinger Group is delighted to announce the appointment of its new Chair, Sarah Deaves.

Drawing upon her extensive background in the wealth management industry, Sarah brings a breadth of experience and a clear vision to Hottinger group. Currently MD of abrdn Financial Planning, Sarah previously served as CEO of Coutts and a wide range of other executive leadership roles across financial planning and wealth management. Sarah is well-positioned to steer our company towards continued excellence. Her strategic insights, coupled with her commitment to fostering collaboration and driving innovation, will undoubtedly increase our organization’s capabilities and market presence.

Mark Robertson CEO Hottinger Group said “With a proven track record of dynamic leadership and innovation, Sarah is poised to support our strategic objectives as we embark on an exciting new chapter in the group’s history.”

Sarah Deaves said “I am excited to be joining Hottinger Group as its first independent chair and to be working with the Board on this next important growth phase”.

Hottinger Group warmly welcomes Sarah to this important new role as its Chair.

Chart of the Week – The Widening Dispersion Between Big Tech and the Wider Tech Sector

by Tim Sharp, researched by Jack Williams


In the backdrop of this year’s notably narrow equity market performance, investors are meticulously scrutinising the latest earnings per share (EPS) estimates and revisions from analysts. This heightened vigilance stems from the increasing confluence of contradictory data, further exacerbating the intricacies of an already complex market backdrop. Even seasoned investors find themselves unsettled by these developments as underscored by the recent remarks of prominent investor and trader, Paul Tudor Jones. In a recent interview with CNBC, Jones said that the current geopolitical landscape presents an unprecedented and formidable challenge, characterizing it as potentially the most threatening and challenging environment he has ever encountered.

However, following a series of negative revisions earlier in the year, EPS estimates for Q3 2023 have remained relatively flat since august, holding steady into the print. The wider US market has fallen 4% over the same period.


Figure 1: Refinitv Data, Bloomberg, Barclays Research


When looking at revisions, there is a widening disparity between big cap technology stocks and the rest of the market. Big cap technology EPS has been revised up 15% YTD while the remainder of the US500 blue chip index showing downward revisions of -6% YTD. In a particularly confusing fashion, there is a vast difference between Big Tech EPS revisions and those seen in the wider tech sector, of which are expected to decline by -6% alike the US500 index.


Figure 2: EPS Revisions 2024, Barclays


This gap in outlook continues into 2023 where big cap tech earnings are expected to rise by 17% compared to -3% for the wider US500 index and -4% for the wider technology sector.

As shown in the chart below, dispersion of analyst forecasts remains high for big tech, but has converged for the rest of the US500.


Figure 3:EPS Revisions 2023, Barclays


Depicted in the chart below, you can see the dispersion of analyst forecasts over the past 18 months. A gap in dispersion emerged, albeit narrow, in H1 23’. This was caused by a convergence of macro uncertainties, combined with upwardly revised tech estimates leading to the AI/Tech fuelled rally which pushed indices higher as companies like Nvidia upgraded their outlook. The rest of the market did not enjoy such an uplift, instead seeing downward revisions. Although the wider technology sector enjoyed positive revisions till May of 2023, the sector (ex-big tech) has seen revisions since, leading to the widened gap shown below.


Figure 4:Dispersion of Analyst Forecasts (US500) Barclays


Bibliography

Chartbook, D. (2023). Daily Chartbook #303. [online] www.dailychartbook.com. Available at: https://www.dailychartbook.com/p/daily-chartbook-303

Squawk Box, C. (2023). CNBC Transcript: Tudor Investment Corporation Founder & CIO Paul Tudor Jones Speaks with CNBC’s ‘Squawk Box’ Today. [online] CNBC. Available at: https://www.cnbc.com/2023/10/10/cnbc-transcript-tudor-investment-corporation-founder-cio-paul-tudor-jones-speaks-with-cnbcs-squawk-box-today.html.

Research, B. (2023). Barclays Research – Food for Thought: A Convergence in Dispersion. [online] live.barcap.com. Available at: https://live.barcap.com/PRC/publication/CL_TEJ-IH4gfiB-IH4g_652824d5cc762f71f409aaee.

Research, B. (2023). Barclays US Equity Research – Food for Thought: A Divergence in Dispersion. [online] live.barcap.com. Available at: https://live.barcap.com/PRC/publication/CL_TEJ-IH4gfiB-IH4g_64b07d22a652195b94c79464.


Chart of the Week: Transporters – Under Pressure

Author: Tim Sharp

Researcher: Jack Williams

Published: September 22, 2023


As the holiday season comes to a close and the out of office announcements begin to dissipate for the year, we dive into transportation as a sector, with particular attention to airlines and whether the recent stall in share prices is telling of greater problems further along their flight path.

The US500 Transportation index has enjoyed a monstrous climb since the turn of the year, rising by over 15% from the start of January to its peak around the end of July. Since, performance has reversed, declining 10.7% to current levels.

Figure 1 – US Transportation Index (Refinitv Data/Hottinger)


Demand for transportation services softened as both imports and exports fell within the US, further exacerbated by consumers continued prioritisation of services, experiences and entertainment and turning a blind eye to goods since the ending of the pandemic period.

Furthermore, this change in consumer behaviours has resulted in a US inventory correction made worse by the ongoing slowdown seen in countries like China and Germany.

Let’s also not forget the mass of cost increases being faced by transporters of goods such as fuel prices and employee wages, both of which have recently crept up further.

Transport industries July 31st – September 12th:

Passenger Airlines -13.5%
Air Freight + Logistics -12.9%
Rail Transport -9.4%
Cargo Ground Transport -3%

Figure 2-Transportation Industry Performance By Subsector (Yardeni Research Inc.)


The airline industry in particular had saw a huge rally in the start of the year, flying over 34% from January to the sectors peak on July 11th, since the industry has seen share prices slide, reducing that monstrous 34% gain to just 9.2% at the time of writing.

Figure 3 – NYSE Airline Index (Refinitiv Data)


Airlines, perhaps more than most in the sector are feeling the brunt of the cost increases, American Airlines warned on Wednesday of higher fuel and wage costs eating into Q3 profits the extent of cutting their Q3 earnings expectations by more than 60%, from 95 cents per share to a guidance of 20-30 cents.

Wage Pressures on Airline Industry Through Recent Contract Negotiations:

JetBlue 24 Month Contract +21.5% Wage Increase
Delta Air 36 Month Contract +34% Wage Increase
American Airlines 48 Month Contract +40% Wage Increase
Alaska Airlines 12 Month Contract +11.5% Wage Increase

Figure 4 – Wage Negotiations Across Airlines (Yardeni Research Inc.)


With Crude Oil on the rise, having risen from a low on the year of $71.26 to $93.23 at the time of writing, this is yet another reason for Airline Operators to worry, buoyed by Saudi production cuts, summer driving season in the US, a depleted US S.P.R (Strategic Petroleum Reserve) and an uptick in travel demand over the summer with many unable/unwilling to travel through the pandemic period.

Figure 5 – Crude Oil Spot Price (Refintiv Data)


As with many industries in this complex market backdrop, Airline operators are hoping for wage pressures to ease having paid out over inflationary level hikes in pay, and for OPEC members to increase production given the current global supply shortfall and willingness of other smaller nations to step up production to take advantage of heightened prices, but for this only time will tell.


Sources:

Alabi, L.O. and Nilsson, P. (2023). British Airways and union agree 13% pay rise for 24,000 staff. Financial Times. [online] 4 Aug. Available at: https://www.ft.com/content/05ad4936-16ed-4c3f-a6fc-a3d1af7dec6d.

Gunnion, S. (2023). Airline stocks lose altitude as American Airlines and Spirit cut 3Q guidance on rising fuel prices. [online] Proactiveinvestors NA. Available at: https://www.proactiveinvestors.com/companies/news/1026412/airline-stocks-lose-altitude-as-american-airlines-and-spirit-cut-3q-guidance-on-rising-fuel-prices-1026412.html.

Paraskova , T. (2023). IEA: OPEC+ Production Cuts To Send Oil Prices And Volatility Surging. [online] OilPrice.com. Available at: https://oilprice.com/Energy/Energy-General/IEA-OPEC-Production-Cuts-To-Send-Oil-Prices-And-Volatility-Surging.html.

Roa, N. (2023). Stratus Financial Blog – JetBlue Pilots Agree to Contract Extension. [online] Stratus Financial. Available at: https://stratus.finance/jetblue-pilots-agree-to-contract-extension/#:~:text=JetBlue%20Airways%20pilots%20have%20agreed,slow%20progress%20in%20labor%20deals.

Yardeni, E. (2023). Transports Flying into Headwinds. [online] https://www.yardeni.com/premiumdata/mb_230914.pdf?utm_campaign=Morning%20Briefing&utm_medium=email&_hsmi=274192225&_hsenc=p2ANqtz—qK8nPbDkFtC8uCjwUTvHJxdGUhzXE7rVmLxZDC1ge73jInYuFGv4PQYRBjJPRnal53ocIrLeixupPHIn3awKhp89noEH1mJalsaKDeem46NR2zw&utm_content=274192225&utm_source=hs_email

Chart of the Week: The China Syndrome

Author: Tim Sharp

Researcher: Jack Williams

Published: August 25, 2023


Economic woes in China are proving to be worse than initially feared. As we entered the year, many investors were optimistic, expecting to see the economy boom as the country relaxed its Zero Covid lockdowns and rules. As disappointment shrouded the region’s markets, China bulls became expectant, hoping dismal data would force the hands of government officials towards the stimulus lever, which on numerous occasions over the past couple of decades has resulted in an uplift in not just China GDP, but global growth as well.

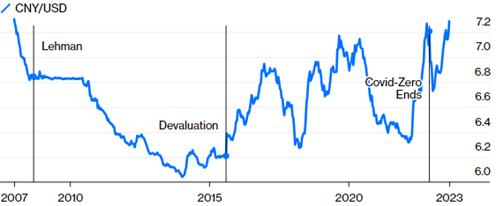
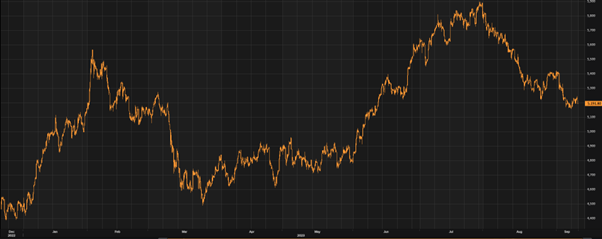
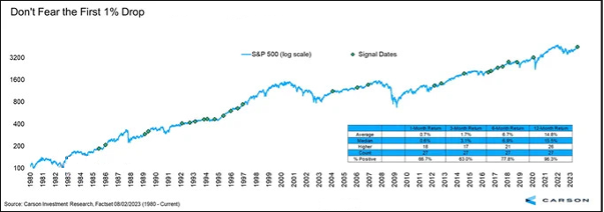
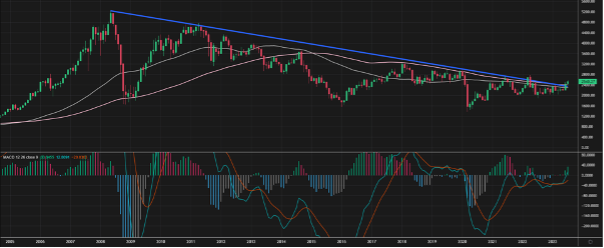
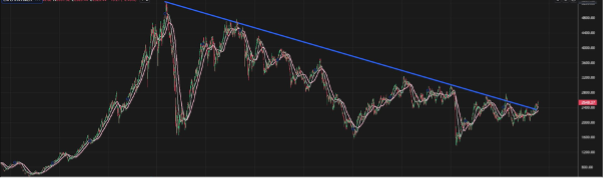
Figure 1 – CNY/USD (Bloomberg Data/Bloomberg.com)


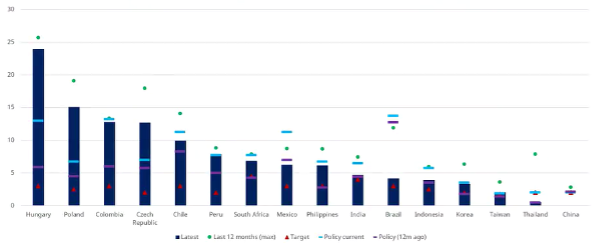
But how far will the CCP (Chinese Communist Party) have to go to create a meaningful impact, especially since the PBOC (Peoples bank of China) cut rates last Tuesday by 15bps, a move swiftly shrugged off by most. Over the past month or so, we have seen Central Banks such as Peru and Brazil cut rates, each of which were met by a positive response in the markets (although these rate cuts were widely expected).

Prior to the event, 93% of Bloomberg economists surveyed said they did not expect any change in the PBOC bank rate, with just a single economist expecting a cut. The country is currently grappling with a worsening property sector, weak consumer confidence and spending along with mortifying economic data, all of which this latest policy shift has not provided any respite to.

As shown above, China’s biggest bruise is the one on its currency. The Yuan now sits at a similar level to before covid restrictions began to lift and close to a 14-year low marked in 2007 prior to the Lehman collapse. In the last 24 hours, China’s central bank has asked domestic lenders to scale back outward bond investment aimed at limiting the supply of Yuan offshore, its latest attempt to shore up the currency.

Furthermore, the main metrics of economic activity in the region are all flashing red with industrial production, property investment, and retail sales all at their lowest levels since turn of the millennium.

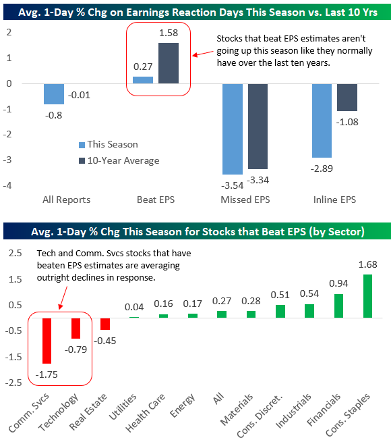
Shown below is a range of metrics (Industrial Production, Property Investment, Fixed Asset Investment such as infrastructure and Retail Sales) shown via a 6-month moving average.


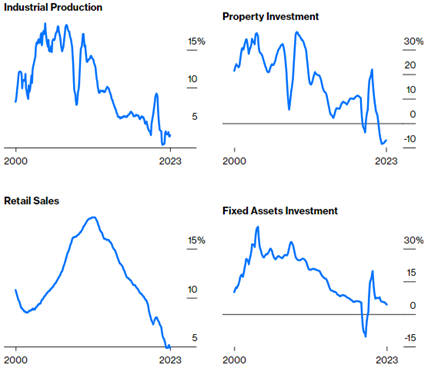
Figure 2-6M Moving Average of YoY Growth Metrics (Bloomberg Data/Bloomberg.com)


All these metrics are at, or near two-decade lows, with property investment falling off a cliff, industrial production readings falling short of expectations and retail sales plummeting at a gradient that would surely be a black run if found on a ski resort. Only fixed income investment is off its lows, but in recent months even this metric has begun falling again.

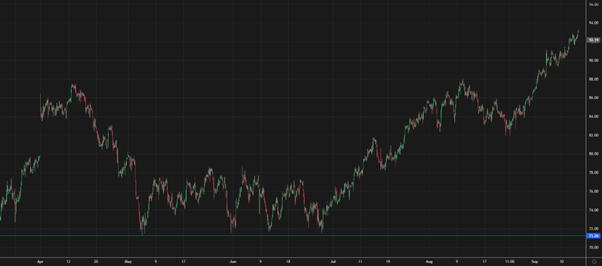
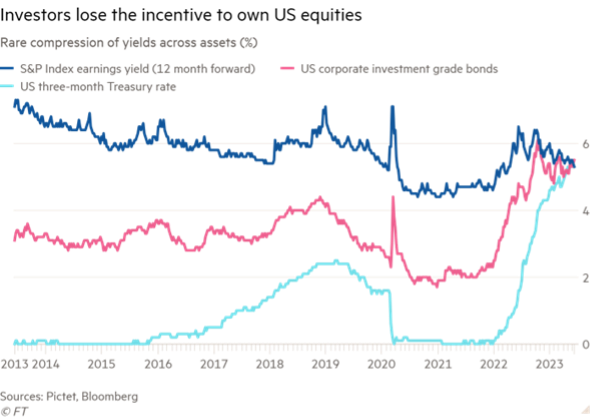
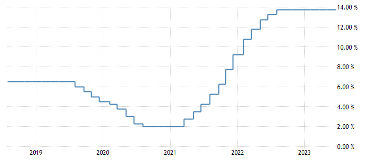
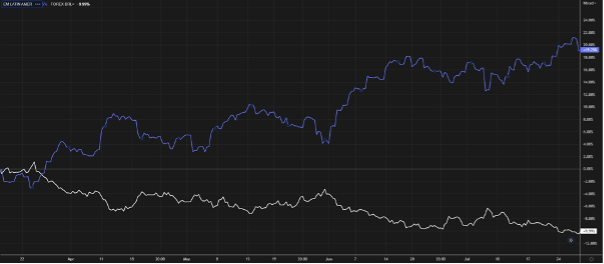
The PBOC cut rates on its medium-term lending facility last week by 15 bps to 2.5%, marking its second cut since June and the highest cut since 2020. Immediately following the cut, reactions suggested little excitement was generated from investors with any gains on indices being quickly absorbed as investors digested the surprise move.

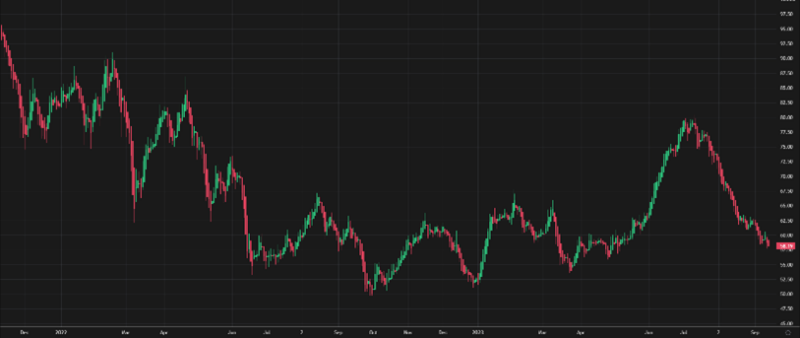
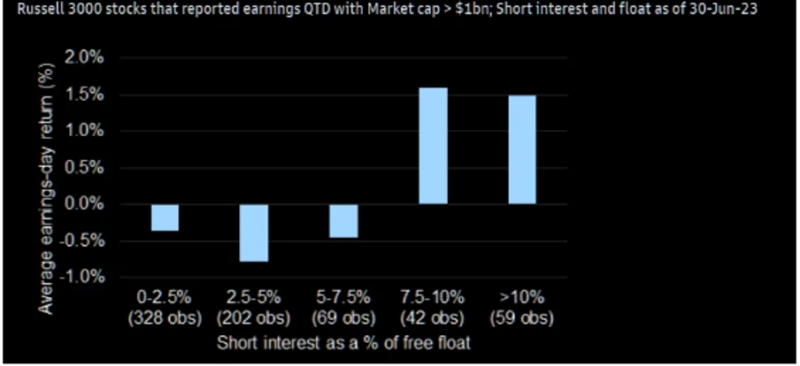
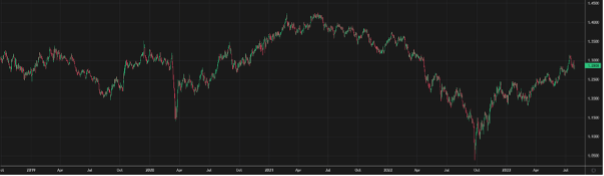
The Hang Seng Index is down 9.6% from the start of the year, down 6.3% on the month and flat on the week. It Is clear further stimulus would be needed to raise China’s economy, but Xi Jinping has of yet resisted plans for further additions of stimulus into the economy particularly around the property sector, of which numerous red flags are re-emerging.

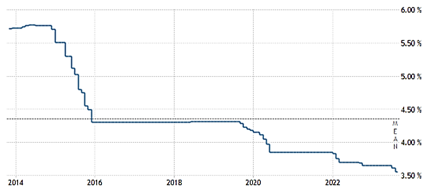
Figure 4-PBOC 1Y Loan Rates (PBOC/Bloomberg)

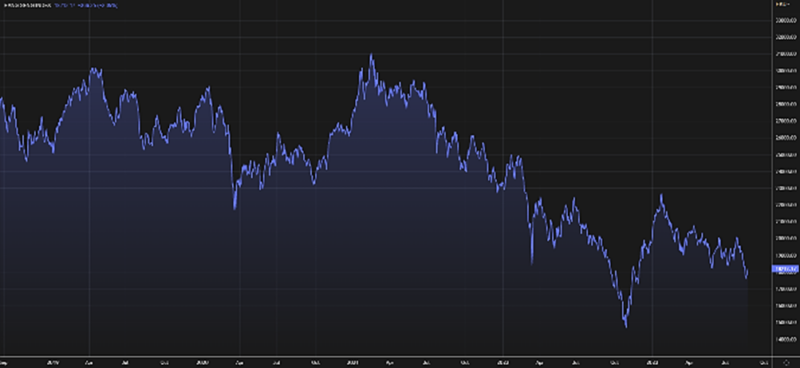
Figure 3-Hang Seng Index (Refinitiv Data)

While the property sector continues to give flashbacks to the Evergrande calamity in the back end of 2021. In recent weeks developers such as Country Garden have missed coupon payments on their USD based bonds. Over the past two years calamities within the property sector have wiped out a whopping $87 billion dollars from the industry.

At the time of writing China announces plans to cut stamp duty on domestic stock trading by as much as 50% in a bid to rescue their equity markets. Whether this will work, only time will tell, although it does feel lacklustre compared to the number of issues the region faces.

Earnings within China have been mixed as of late, although tech behemoths such as Apple, Bite Dance (Private Co.), Alibaba, Tencent and to some extent JD.com all reported improvements in China based sales while Shanghai Disneyland saw record high revenue, operating income and margins through the quarter, narrative echoed by Universal Studios Beijing which enjoyed its most profitable quarter since opening.

This paints a picture of bifurcation amidst China’s economy, with huge swathes struggling, whilst others seemingly enjoy similar trends such as increased prioritisation of experiences and entertainment which we have seen since earlier reopening following the pandemic in developed markets. Looking forward it will be vital for China to capitalise on those parts of the economy doing well (Leisure, Entertainment, Food, Technology) whilst introducing confidence back into markets and consumers to address these severe areas of weakness alike property and general retail.


Cheng, E. (2023). What China’s big earnings say about the consumer. [online] CNBC. Available at: https://www.cnbc.com/2023/08/18/what-chinas-big-earnings-say-about-the-consumer.html

Liu, P. (2023). Country Garden Leaves Investors in Dark on Exact Default Deadline. Bloomberg.com. [online] 22 Aug. Available at: https://www.bloomberg.com/news/articles/2023-08-22/country-garden-default-deadline-becomes-guesswork-for-creditors.

Trading Economics (2019). China Loan Prime Rate. [online] Tradingeconomics.com. Available at: https://tradingeconomics.com/china/interest-rate.

Hancock, T. (2023). China’s Consumer Sentiment Starting to Improve, Surveys Show. Bloomberg.com. [online] 24 Aug. Available at: https://www.bloomberg.com/news/articles/2023-08-24/china-s-consumer-sentiment-starting-to-improve-surveys-show.https://www.theguardian.com/business/2023/aug/23/china-economic-model-property-crisis

News, B. (2023). How China’s Faltering Growth Threatens to Derail Commodities Markets. Bloomberg.com. [online] 22 Aug. Available at: https://www.bloomberg.com/news/articles/2023-08-22/how-china-s-faltering-economic-growth-threatens-to-derail-commodities-markets.

Lehner, U.C. (2023). Debating the size of China’s economic rough patch. [online] Asia Times. Available at: https://asiatimes.com/2023/08/debating-the-size-of-chinas-economic-rough-patch/.

Chart of the Week: Keeping Up with The Corporations – A Disappointing Earnings Season for Beats and Misses

Author: Tim Sharp

Researcher: Jack Williams

Published: August 9, 2023

In the past, companies were often rewarded for meeting or exceeding analyst projections, and investors would respond positively to earnings reports. However, recent earnings periods have been far from the norm, characterized by exacerbated moves in both the up and downside as shifts in market themes and uncertain macro backdrops collide, leading to increased volatility. This is particularly evident in the current earnings season, where companies missing expectations or issuing lacklustre guidance are being heavily punished by the market.

Earnings Reactions:

The chart in Figure 1 illustrates the stark contrast between companies beating estimates and underachievers in the market. The average one-day percentage change as a reaction to earnings over the last ten years has been negligible at -0.01%. However, in the current earnings season, this figure has dropped to -0.8%, indicating a significant difference from the historical average.

Figure 1 – Reactions (% Change) on Earnings Day vs L10y Avrg
Source: Bespoke Investment Group

Moreover, the average reaction to Earnings-Per-Share beats in the past was a positive 1.58%, leading to an increase in share prices. In contrast, the current earnings season has shown an average reaction of only +0.27%, considerably lower than the historical average. Companies missing EPS revisions also saw slightly worse reactions this earnings season, with an average drop of -3.54%, compared to -3.35% over the last ten years. Companies meeting expectations are also experiencing more negative reactions, with an average decline of -2.89%, reflecting investors’ preference for outperforming businesses amidst the current uncertain macro environment.

Real Estate has struggled due to a weak macro backdrop for housing, even for those companies beating EPS, with an average decline of -0.45%. Technology also faced challenges as heightened expectations during earnings season, driven by the tech/AI-led rally in US stocks, pushed valuations to previously high pandemic territory once again. This resulted in an average reaction of -0.79% to a positive EPS beat within the sector. Communication Services also struggled in this earnings season, affected by weaker business sentiment, lower consumer confidence, and market stories such as lead cable contamination, which led to shares, such as AT&T, hitting 30-year lows.

Short Interest Effect:

Figure 2 – Russell 3000 Earnings Reactions By Short Interest Group
Source: Goldman Sachs

Data from Russell 3000 earnings suggests that short interest may be playing a significant role in earnings reactions. Stocks with short interest as a percentage of free float at over 7.5% posted earnings day returns of at least 1.5% on average, with 7.5%-10% being the sweet spot, producing +1.6% returns on earnings day compared to negative average returns for stocks with less than 7.5% short interest as a percentage of free float.

Conclusion:

The recent earnings season has been marked by increased volatility, with companies facing heightened scrutiny for their performances. Market themes and macroeconomic uncertainties have played a significant role in shaping investors’ reactions to earnings reports. Sector-specific challenges have also impacted reactions, with the Real Estate, Technology, and Communication Services sectors facing difficulties.

While this can be confusing and perhaps points to potential weakness around future earnings periods during times of uncertainty and macro inconsistence, this may not be the case. As nerves reemerge following a monster rally in the US year to date and the first 1% drop in the US Blue Chip Index in over two months, data from similar situations points the opposite direction as the typical outcome.

The chart below shows US500 performance after the first 1% drop in more than two months, which on average yields investor returns of 14.8% one year later. Obviously, nothing is guaranteed, but as the old saying goes, history tends to repeat itself, which I’m sure in this case, should it happen, would be warmly welcomed by many investors.

Figure 3-SPX Performance after first 1% Decline After More Than Two Months Without One
Source:Carson Investment Research

Sources:

Investment Group, B. (n.d.). Bespoke Daily 📊 – No Love for Beats. [online] us11.campaign-archive.com. Available at: https://mailchi.mp/bespokepremium/bespokes-morning-lineup-553274?e=33d57ea167.

Detrick, R. (2023). Volatility Is The Toll We Pay. [online] Carson Group. Available at: https://www.carsongroup.com/insights/blog/volatility-is-the-toll-we-pay/

Anon, (n.d.). S&P 500 Stocks – Average Earnings Day Moves – ISABELNET. [online] Available at: https://www.isabelnet.com/sp-500-stocks-average-earnings-day-moves/

The Market Ear. (2023). The Market Ear | Live news, analysis and commentary on what moves markets and trading. [online] Available at: https://themarketear.com/newsfeed

THE SHORT AND LONG OF RECENT VOLATILITY. (n.d.). Available at: https://www.goldmansachs.com/intelligence/pages/gs-research/the-short-and-long-of-recent-volatility-f/report.pdf

Chart of the Week – Latin American Equities

Primed for a New Bull Market After Breaking 15+Year Trendline?

Author: Tim Sharp

Researcher: Jack Williams

Published: July 28, 2023

Developed economies have recently surprised on the upside following a long streak of losses causing Latin America to fall off the radar for many investors. However, these markets may be at a pivotal point and could be headed for brighter days ahead. The MSCI Emerging Markets Latin America ETF chart above depicts a sustained fall in price since its peak in 2008, declining from over $5200. Each candlestick in the chart represents one month’s worth of price action.

Figure 1-MSCI EM Latin America ETF Monthly Candles

The blue trendline illustrates the “slow puncture” effect witnessed in these markets over the past 15+ years, as capital gradually withdraws from the region. We believe Latin American Equities may be at a significant turning point, as future catalysts, current conditions, and our global outlook aligns, creating what some investors may describe as the perfect storm for Latin America. This month, bulls have broken through the long-term negative trend, turning heads investors heads as the case for LatAM builds.

In this article, we delve into a few interesting reasons why particular attention is being paid to this region as of late.

Figure 2-MSCI EM LatAM ETF Daily Candles 2008-Current

Inflation:

Inflation is a critical factor that cannot be ignored. Latin American countries have more experience in dealing with high and sticky inflation compared to most developed markets in recent history, having tackled numerous bouts of high level inflation. Learning from past experiences, central banks in the region took proactive measures to counteract its effects, aggressively hiking rates at a rapid pace. Brazil’s base rate rose from 2% in 2020 to the current level of 13.75%, which has been maintained for the seventh consecutive meeting (June 2023).

Figure 3-Caption: EM Inflation – Headline inflation has been easing, monetary policy has tightened. (Schroders, Refinitiv Datastream Data to May 2023).

The chart above illustrates the easing of headline inflation while monetary policy has tightened across emerging market nations. The dark blue bar represents the current level of inflation, with the green dot showing peak inflation over the past 12 months. The cyan-coloured dash indicates the current level of monetary policy (e.g., Brazil at 13.75%), while the red triangle represents the target level of inflation. Additionally, a purple line shows monetary policy twelve months ago, revealing a push upwards and rapid decline in inflation well below peak levels for LatAM nations and in a much better place to cut rates sooner than most developed markets. At the current time of writing, Chile is expected to cut rates by 75bps following a 9 month hold at a rate of 11.25%, other nations are expected to follow suit in the coming months.

Figure 4-Brazil Central Bank Rate (TradingEconomics Data)

The US Dollar has shown notable weakness in recent months, as depicted in the sterling USD pairing chart below, showing that since October’s mini-budget debacle, sterling has outpaced the greenback.

Figure 5-GBP/USD
Figure 5-GBP/USD

A similar story can be observed when looking at Latin American currencies, such as the Brazilian Real, charted against the MSCI Latin America Index. The USD/Real chart shows that as the USD peaked, the Brazilian Real’s strength took over, leading to an upward march in the MSCI Latin America Index.

Figure 6-USD/REAL (White) MSCI LATAM ETF (Blue) Rebased to Par.

Onshoring:

Onshoring or reshoring is a relatively new concept that has gained traction due to global tensions. It involves moving key components, materials, manufacturing hubs, and business infrastructure closer to home for businesses. The move towards onshoring has been driven by growing tensions with manufacturing nations like China, as well as uncertainties about Taiwan, further exacerbated by the COVID supply chain disruptions and the Russia-Ukraine war.

Countries like Mexico are poised to be major beneficiaries of this onshoring trend, potentially leading to increased GDP growth. Developments of factories, infrastructure, and higher-paying jobs may follow as states look to secure supply and manufacturing of crucial industries, such as semiconductors, closer to home.

In conclusion, Latin American equities appear to be at a turning point, with favourable conditions and global trends aligning in their favour. The region’s experience in managing inflation, the weakening US Dollar, and the added element of onshoring could potentially contribute to brighter horizons ahead for Latin American Equities


Sources:

Benedito, L.M. and Burin, G. (2023). Brazil central bank to keep rates steady on June 21, cuts coming soon. Reuters. [online] 16 Jun. Available at: https://www.reuters.com/markets/rates-bonds/brazil-cbank-keep-rates-steady-june-21-cuts-coming-soon-2023-06-16/

Uddin, R. and McDougall, M. (2023). Latin America’s bonds and currencies lure yield-hungry investors. Financial Times. [online] 6 Jul. Available at: https://www.ft.com/content/c04c3a04-8c36-4822-813b-28f25e2ba067

Uddin, R. and McDougall, M. (2023). Latin America’s bonds and currencies lure yield-hungry investors. Financial Times. [online] 6 Jul. Available at: https://www.ft.com/content/c04c3a04-8c36-4822-813b-28f25e2ba067.

Cambero, F. (2023). Chile to start rate cuts, signaling more across the region. Reuters. [online] 27 Jul. Available at: https://www.reuters.com/markets/rates-bonds/chile-start-rate-cuts-signaling-more-across-region-2023-07-27/

Nair, D. (2023). US dollar weakness expected to continue as inflation cools. [online] The National. Available at: https://www.thenationalnews.com/business/money/2023/07/13/us-dollar-weakness-expected-to-continue-as-inflation-cools/#:~:text=The%20currency%20slumps%20to%20a

Goodkind, N. (2023). Why the Fed paused its rate hikes: It’s tired of playing a giant guessing game | CNN Business. [online] CNN. Available at: https://edition.cnn.com/2023/06/16/investing/premarket-stocks-trading/index.html#:~:text=After%2010%20consecutive%20interest%20rate

For Swaps Traders, Latin America’s Rate-Cut Cycle Comes Too Late. (2023). Bloomberg.com. [online] 27 Jul. Available at: https://www.bloomberg.com/news/articles/2023-07-27/for-swaps-traders-latin-america-s-rate-cut-cycle-comes-too-late

US Says It Must Work With Latin America More on Key Minerals. (2023). Bloomberg.com. [online] 26 Jul. Available at: https://www.bloomberg.com/news/articles/2023-07-26/us-must-step-up-latam-work-on-critical-minerals-state-aide-says

Chart of the Week: Convergence of Returns Amongst Cash, Bonds, and US Equities

Author: Tim Sharp

Researcher: Jack Williams

Published: June 27, 2023

In a notable turn of events, the recent market rally in the United States has led to the erasure of the premium traditionally associated with owning shares in US companies. This phenomenon is particularly evident in the convergence of yields between cash, bonds, and equities. Currently, three-month Treasury bills offer a yield of 5.3% following a brief pause in interest rate hikes by the Federal Reserve, which has maintained the interest rate in the range of 5-5.25%. Although the central bank has hinted at a potential double increase in rates towards the end of the year, it remains uncertain.

Comparisons between the price-to-earnings (P/E) ratios
Figure 1- US500 Earn Yld (Dark Blue), US IG Bonds Yld (Pink), US 3M Treas Rate (Cyan. S: Pictet/Bloomberg)

This convergence of yields across different asset classes is unprecedented in history. As depicted in the accompanying chart, the earnings yield of the US500 (S&P 500) now matches that of cash and bond yields. This is a significant departure from the situation less than six months ago, when the US500’s earnings yield exceeded 6%. The recent surge in US markets, primarily driven by the technology sector and semiconductor industry, has contributed to this decline in the earnings yield.

Comparisons between the price-to-earnings (P/E) ratios of the US500 index and its European counterparts have raised concerns amongst investors.

The US500 currently boasts a P/E ratio of 23 times earnings, 56% higher than the Stoxx 600’s valuation of 13 times earnings in Europe.

One explanation for this disparity lies in the differing sector composition between the two regions.

Europe has fewer companies operating in the technology and semiconductor sectors, which have been key drivers of the recent market rally. However, some asset managers, including Christian Kopf of Union Investment, argue that bonds offer US investors better risk-adjusted returns compared to the current state of the markets.

On the other hand, Pictet, another asset manager, is seeking alternative sources of alpha and identifies European and Asian equities as potentially outperforming their US counterparts in the latter half of the year.

Figure 2- US500 P/E Ratio 1928 – 2023 (Refinitv/Hottinger Investment Management)
Figure 3- Nikkei225/Stoxx600 P/E Ratio (Refinitv/Hottinger Investment Management)

This convergence of returns is not limited to equities and three-month treasuries; it also extends to investment-grade bonds and cash yields. According to a recent survey by Bank of America, investment-grade bonds are experiencing the highest overweight positioning since 2008, with a net allocation of +10% in this space.

In conclusion, the recent market rally in the United States has resulted with matched yields among cash, bonds, and equities, which is an unprecedented occurrence in history. The decline in the earnings yield of the US500 reflects the strong performance of US markets, driven by the technology sector and semiconductors, which has not been seen in the Eurozone area to the same extent. The disparity in P/E ratios between the US500 and European indices can be attributed to differences in sector composition to some extent, however, there has been a long-standing valuation gap between US markets and the EU and UK markets which many are wondering whether this could be a reason for such gap to narrow or close, however, that is yet to be seen.


Referencing

Bloomberg Data, Bloomberg Data. “Bloomberg – Asia Pacific Stocks.” Www.bloomberg.com, Bloomberg Financial Data, 21 June 2023, www.bloomberg.com/news/articles/2023-04-18/investors-turn-most-underweight-stocks-versus-bonds-since-2009#xj4y7vzkg.  Accessed 21 June 2023.

Mosolova, Daria, and Mary McDougall. “Rate Rises Erode Investors’ Incentive to Hold US Companies’ Shares.” Financial Times, 18 June 2023, www.ft.com/content/79b7775a-fe35-4591-ae4a-cc31eea1c81c.  Accessed 21 June 2023.

Research, Siblis . “P/E & CAPE Ratio of Nikkei 225 & Japanese Stock Market.” Siblis Research, 20. 2023, www.siblisresearch.com/data/japan-nikkei-pe-cape/.   Accessed 21 June 2023.

Research Service, MacroTrends. “S&P 500 PE Ratio – 90 Year Historical Chart.” Www.macrotrends.net, 21 June 2023, www.macrotrends.net/2577/sp-500-pe-ratio-price-to-earnings-chart.

Reddy, Sam Moore, Rohan. “Global X 1-3 Month T-Bill ETF (CLIP).” Global X ETFs, 21 June 2023, www.globalxetfs.com/introducing-the-global-x-1-3-month-t-bill-etf-clip/.  Accessed 21 June 2023.

Chart of the Week: Unprecedented Concentration in Equity Markets Raises Concerns – Will History Repeat Itself?

Author: Tim Sharp

Researcher: Jack Williams

Published: June 14, 2023

The year of 2023 has been an anomaly for many reasons, perhaps the main one being the extreme concentration within equity markets, especially within recent months. Defined here as the concentration of top 10 leaders to the three-month performance of the US500, is above the 99th percentile over the past 30 years.

Shown below in figure one, you can see in light blue the weighting of the top ten leaders within the US500, and in dark blue the contribution of those top ten leaders.

Figure 1-Refinitiv Data / Barclays Research

Stock Weighting YTD Performance PE Ratio
Apple (AAPL) 7.50 +46.57% 31.14
Microsoft (MSFT) 6.7 +39.53% 36.23
Amazon (AMZN) 3.1 +47.59% 307.09
Nvidia (NVDA) 2.6 +186.57% 213.19
Alphabet (GOOGL) A 2.203 +38.95% 27.96
Tesla (TSLA) 1.846 +139.32% 76.17
Alphabet (GOOG) C 1.7737 +38.72% 28.09
Meta Platforms 1.658 +117.51% 34.63
Berkshire Hathaway (BRK.B) 1.651 +8.54% N/A
United Health Group 1.26904 -5.27% 22.47


Since the mid 1990’s there has only been two instances with comparable levels of concentration, the first being the 2000 dot com bubble, and the second being the 2020 Covid rebound, both opposites in terms of outcomes for the market.

Figure 4 – 2020 Covid Rebound (Refinitiv Data)

Figure 5 – Dot-Com Market Low (Refinitiv Data)


During the 2020 Covid Rebound, the market ripped higher by +20% while the top ten underperformed the US500 remaining flat for the first 9 months. Following this nine month period, the US500 rallied further instead being led by the top 10 stocks. 10 Leaders rallied +33% while the US500 ripped higher by 15%, highlighting the dramatic outperformance in this period by the top 10 names.

Market participants are currently weighing up which scenario, 2020 rebound or dot com era misery will prevail. With the debate amongst institutions continuing, recently several houses have been making their views known as to whether they view the latest rally as worth participating in.

Barclays equity strategists commentary has been increasing in positivity recently regarding the US main market. Within a research note issued by Barclays on the 13th of June entitled “Equity Options Not Pricing for Any Surprises”, strategists issued the firms belief the current situation is closer to that seen in the Covid rebound, with the main reasoning being the dramatic difference in valuation multiples seen in the Dot Com period compared to the current market, which although higher than where a bull market typically starts are still a long way from the lofty multiples being touted in the 2000’s period.

Figure 2 – Refinitiv / Bloomberg / Barclays Research


It is worth however noting that a bear market historically has not bottomed at multiples seen currently in these markets. The most expensive bear market low to date was the US500 following the dot-com bust, in which US500 PE’s stood at 13.5 times. The second most expensive bear marker bottom was the covid rebound  in 2020 where earninsg stood at 13.5 times earnings.

Figure 3 – Refinitiv / Hottinger Investment Management


Morgan Stanley, on the other hand, are much more bearish in their forecast. With the US500 rally now crossing the 20% threshold, many are declaring the bear market officially over. Morgan Stanley are not in this camp, quite the opposite infact. M.S are predicting a V shaped earnings recession/recovery within their forecasts.

Over 70% of the US500’s industry groups grew forward earnings expectations by 20% above pre covid levels. Morgan Stanley’s forecast of earnings stand well below current consensus. Even being so far below consensus would still put their figures 10% above the long term earnings trend line.

Figure 6 – M.S Earning Model Suggest Earning Recession Is Not Over (FactSet / Morgan Stanley)


While their forecast was lower than consensus even 6 months ago, the spread between MS and consensus has widened further while the street and buy side have raised their consensus for earnings over recent months.

Figure 7 – Spread Between Morgan Stanley Model & Consensus Rarely Been Wider (FactSet / Morgan Stanley)


Rather than looking at similar rallies or period of concentration, M.S are looking at the variables that led us to our current situation and when similar variables such as Fed hiking cycles, sticky inflation and build up of savings occurred in the past.

Figure 8 – M.S Base Case EPS Estimate Still Above Long-Term Trend (FactSet / Morgan Stanley)


Perhaps the most notable period, and which Morgan Stanley have chosen to focus on is the post WWII period. This was similar in a way where excess savings were built up and unleashed into the economy during a supply constrained environment, where inflation surges as a result.

In this case asset prices surged to prior cycle highs at a historically rapid pace. The boom in inflation and earnings lef to the Fed tightening at the fastest rate in 40 years… Sound familiar?

The boom and fed reaction caught many investors off guard, with M.S expecting many to be surprised once again by the depth of their forecasted earninings recession with the sharp V shaped recovery they forecast in 2024.


Referencing:

Research, B., Gupta, A., Pascale, S., Kang, V. and Dass, R. (2023). “Equity options not priced for any surprises ahead of heavy macro week” .

Barclays Research, Barclays Research / Barclays Live: Barclays Research , pp.1–7.

‌www.macrotrends.net. (n.d.). S&P 500 PE Ratio – 90 Year Historical Chart. [online] Available at: https://www.macrotrends.net/2577/sp-500-pe-ratio-price-to-earnings-chart.

Ward, S. (2022). Why Stock Multiples Say the Market Could Continue to Drop. [online] Morningstar, Inc. Available at: https://www.morningstar.com/markets/why-stock-multiples-say-market-could-continue-drop.

Slickcharts (n.d.). S&P 500 Companies – S&P 500 Index Components by Market Cap. [online] www.slickcharts.com. Available at: https://www.slickcharts.com/sp500.

Wilson, M.J., Pauker, A.B., Weaver CFA, M.M., Ding PHD, D. and Lentini, N. (2023). Weekly Warm-Up: The Bear Is Still Alive Based on Our Boom/Bust Framework. Morgan Stanley Research: Morgan Stanley Research.

Statista. (2023). Europe: PE multiples technology & telecommunications 2022. [online] Available at: https://www.statista.com/statistics/1028379/price-earnings-in-the-technology-and-telecommunications-sector-in-europe/.

Chart of the Week: Erdogan Elected Causes Financial Volatility, Will Anything Change This Time?

Author: Tim Sharp

Researcher: Jack Williams

Published: June 1, 2023

After Turkish President Tayyip Erdogan’s re-election, Turkey’s financial markets once again experienced turbulence, as the Turkish Lira reached an all-time low against the US dollar, and the country’s sovereign bonds depreciated in value. Erdogan, who has been in office since August 2014, secured another five-year term, defeating opposition leader Kemal Kilicdaroglu, a Turkish economist, retired civil servant, and social democratic politician who was widely regarded as someone capable of addressing the problems that have arisen during Erdogan’s tenure. Since 2016, Turkey has faced strained relations with most European nations, a decline in media freedom, and, most significantly, an increase in the money supply during periods of high inflation, leading to further inflationary pressures.

Figure 1 – Turkish Inflation Rate (Statista)


Remarkably, Turkey’s inflation rate over the past 12 months has surpassed a 24-year high, soaring to over 85%. These price surges can be attributed to Erdogan’s unorthodox monetary policy, which contradicts the approach taken by other central banks and countries during this period of high inflation. Rather than raising interest rates, as most would expect, Erdogan has pursued a strategy of lowering rates, resulting in spiralling inflation that has negatively impacted the population. Unsurprisingly, this issue featured prominently in the election campaigns of both major parties in the recent election.

Investors have expressed concerns about this matter and have contemplated whether Erdogan might consider revising his monetary policy to restore financial prudence in the country. In recent weeks, an internal party team has hinted at the possibility of such a policy shift.

This renewed enthusiasm has sparked a rally in Turkish equities, particularly in the banking sector. Notably, the broader Turkish Index (BIST) has surged by 11.84%, while the banking-focused Turkish BIST BANKA index has experienced a remarkable rally of 14.94% in the past five trading days alone. Although Turkish Credit Default Swaps (CDS) have only marginally retreated from their elevated levels, decreasing from 624 to 622, the cost to insure against defaults has significantly risen since the beginning of the year. CDS swaps started the year at a rate of 513, representing an increase of 21.2% to their current levels.

Figure 2 – Turkish BIST Index (RefinitivData)


Figure 3 – Turkish BIST BANKA Index (RefinitvData)

Turkish investors undoubtedly hope for further declines in CDS rates as Erdogan announces his new cabinet, in the expectation that some positions will be filled by candidates who favour a more open-market approach. This would pave the way for the necessary changes to Turkey’s detrimental monetary policy, which both the country and international investors aspire to witness. Presently, Turkish 10-year bonds offer a yield of 9.705% and have performed poorly compared to other emerging market (EM) debt instruments, with a decline of -5.8% as opposed to the -1.6% decrease observed in the broader EM dollar bond space.

Figure 4 – Turkey CDS (WorldGovBond)


Sources:


Al Arabiya English. (2023). Turkey sovereign dollar bonds rise as markets await Erdogan’s economic team. [online] Available at: https://english.alarabiya.net/business/economy/2023/05/30/Turkey-sovereign-dollar-bonds-rise-as-markets-await-Erdogan-s-economic-team [Accessed 31 May 2023].

Karakaya, K. (2023). Turkish Lira Sinks, Stocks Gain as Investors Bet on Policy Shift. Bloomberg.com. [online] 30 May. Available at: https://www.bloomberg.com/news/articles/2023-05-30/turkish-lira-sinks-stocks-gain-as-investors-bet-on-policy-shift.

Parsons, A. (2023). As Kilicdaroglu takes on Erdogan – here’s why Turkey’s election may well be the most important in the world this year. [online] Sky News. Available at: https://news.sky.com/story/as-kilicdaroglu-takes-on-erdogan-heres-why-turkeys-election-may-well-be-the-most-important-in-the-world-this-year-12879032.

Statista. (n.d.). Turkey monthly inflation rate 2022. [online] Available at: https://www.statista.com/statistics/895080/turkey-inflation-rate/.

TradingEconomics (n.d.). Turkey Government Bond 10y – 2022 Data – 2010-2021 Historical – 2023 Forecast – Quote. [online] tradingeconomics.com. Available at: https://tradingeconomics.com/turkey/government-bond-yield.

Charts/Data – RefinitivData / Hottinger Investment Management / YCharts

Chart of the Week: 2023’s Debt Ceiling Issue Seems Eerily Similar to 2011’s

Author: Tim Sharp

Researcher: Jack Williams

Published: May 25, 2023

The 2011 debt ceiling issue was a significant event that unfolded in the United States, casting a shadow of uncertainty over the country’s financial stability. The dispute, primarily between the Obama administration and the Republican-controlled Congress, revolved around raising the federal debt ceiling to avoid defaulting on the nation’s financial obligations.

The debt ceiling is a statutory limit set by the US Congress on the amount of national debt the government can accumulate, which has been a major story in recent weeks as the US default probability rises, and the country nears their resolution deadline.

In 2011, the United States approached its debt ceiling of $14.3 trillion, leading to a heated political debate. Republicans demanded significant spending cuts and fiscal reforms in exchange for raising the ceiling, while the Obama administration argued for a “clean” increase without any attached conditions.

As we near the 2023 ‘X’ date of the 15th of June 23’ (the date interest payments on U.S debt are scheduled to be made, many institutions such as J.P Morgan, rather than looking forwards are looking backwards to 2011 to gain an idea of how the market might react should the U.S not come to a resolution in time.

Whilst many of the same names (JPM etc.) are cautiously optimistic that discussions between Biden and speaker McCarthy will produce at least a partial deal to either raise or suspend the debt ceiling, as we near the ‘X date’ the risk of default rises dramatically.

The chart below shows the probability of the U.S defaulting, and how the risk of default grows as the ‘X date’ nears. The blue line below shows the probability of default in 2011, as the U.S neared their X date a sharp uptick in risk of default appeared, rising to almost 6%.

The partial grey line follows the risk of a U.S default this year (2023) which has seen a sharp rise recently, similar to moves seen in 2011.


Figure 1 – J.P. Morgan Equity Macro Research, Bloomberg Finance L.P


Figure 2 – Bloomberg Data


Figure 2 below shows short term 1-month T-Bill yields, which as of recent have spiked, suggesting increasing default concerns, a stark contrast to the rallies seen amidst US indices in recent weeks.

In times such as these where volatility is expected, one might expect to see flows into treasuries as investors look to take some risk off the table, however T-Bill have surprisingly traded in the opposite direction, now trading at yields in excess of those seen amidst the 08’ financial crisis.

In 2011, prolonged and contentious negotiations over the debt ceiling caused uncertainty to flood into financial markets, particularly within the U.S as investors worries about the prospect of a default. This led to increased volatility and heightened risk which lasted for nearly three trading months.

In the weeks leading up to the 2011 August 2nd deadline the market experienced significant swings. Throughout July 11’ all major US indices (DJIA, US500 and Nasdaq) witnessed substantial declines. The DJIA for example saw several days of triple digit losses, with the index shedding over two thousand points through a two-week period.


Figure 3 – J.P. Morgan / Bloomberg


During this time, the US 500 index declined by 17% with the brunt of the beating being felt by materials, financials, and energy, while defensive strategies excluding real estate outperformed.

Furthermore, to amplify market turmoil, ratings agency Standard and Poor’s downgraded the US sovereign credit rating from AAA to AA+, marking the first time in history the U.S lost its top tier credit rating.

Figure 4 – SP500 (2011) TradingView

While there are clear differences between the 2011 debt debacle and the current issue, perhaps the largest being the Rate of Inflation and Fed Funds Rate (both of which were dramatically lower in 2011 than today) many lessons have been learned regarding why negotiations must be conducted and concluded swiftly. That being said, one cannot ignore the risk however small of a US default and its potential impact on markets.

Figure 5 – Bloomberg Data


The U.S president Joe Biden has cancelled a planned visit to Australia and Papua New Guinea to focus on debt limit talks, with speaker McCarthy commenting that talks were productive in nature. It is true that the US has never defaulted on its payments before and the debt ceiling has been raised 78 times since 1960 under both republican and democrat presidents, although ex-president Trump is calling for a default as his preferred resolution.

On 26th April Republicans passed a bill in the house that would raise the debt ceiling by $1.5Tr but mandated $4.8Tr in spending cuts over a decade, although democrats have so far refused to negotiate spending cuts over the debt ceiling talks.

Negotiations are expected to resume Wednesday 24th with Republicans looking for some kind of guarantee on spending/budget caps and investors hoping for news regarding some sort of resolution.


Sources:


Asset Management , J.P.M. (2023). How Does the Debt Ceiling Progress From Here? | J.P. Morgan. [online] www.jpmorgan.com. Available at: https://www.jpmorgan.com/wealth-management/wealth-partners/insights/how-does-the-debt-ceiling-progress-from-here#:~:text=With%201Y%20CDS%20at%20a.

Authers, J. (2023). On X+1 Day, We Won’t Be Going Back to Normal. com. [online] 24 May. Available at: https://www.bloomberg.com/opinion/articles/2023-05-24/debt-deal-before-x-1-day-the-us-crisis-will-have-already-begun?leadSource=uverify%20wall.

Aratani, L. (2023). What is the US debt ceiling and what will happen if it is not raised? The Guardian. [online] 17 May. Available at: http://www.theguardian.com/business/2023/may/16/what-is-debt-ceiling-limit-explainer.

BGR Group (2021). History of Debt Limit and Why It Matters | BGR Group. [online] BGR Group. Available at: https://bgrdc.com/history-of-debt-limit-and-why-it-matters/.

Palumbo, A. (2023). Stock Market Today: Dow Drops, Premarket Movers, Debt Ceiling Talks, Fed Minutes, Bitcoin Falls, Nvidia Earnings, China Covid-19. [online] www.barrons.com. Available at: https://www.barrons.com/livecoverage/stock-market-today-052423?mod=article_inline.

P. Morgan (n.d.). Debt ceiling drama: What you need to know. [online] www.jpmorgan.com. Available at: https://www.jpmorgan.com/wealth-management/wealth-partners/insights/debt-ceiling-drama-what-you-need-to-know#:~:text=Today%2C%20that%20limit%20stands%20at.

Chart of the Week: The Gold Vs Copper Conundrum

Author: Tim Sharp

Researcher: Jack Williams

Published: May 18, 2023


In this week’s Chart of the Week, we examine the recent performance disparity between copper and gold, two key commodities, within the context of the current global economic environment. While the overall Goldman Sachs Commodity Index (GSCI) has experienced losses of approximately 30% over the past year, certain commodities within the index have demonstrated strong returns, fuelled by the prevailing high inflation and uncertainty. This study aims to elucidate the drivers behind the contrasting performance of copper and gold by delving into the factors that influence their respective prices.

Copper’s Underperformance

Despite the positive economic growth forecasts, particularly those for China, which exceed 5% in terms of economic expansion, copper’s performance has surprised many investors. Given copper’s extensive use in construction, electrical equipment, wiring, and manufacturing, its price movements are closely tied to global economic growth and investor sentiment. However, the present climate of heightened global uncertainty surrounding economic growth in the US, Eurozone, and UK does not bode well for copper. As a result, the anticipated rise in copper usage, which would tip the supply/demand balance in favour of investors, has not materialized. Consequently, copper has lagged gold in terms of returns.

Copper vs. Gold: The Role of Cyclical Stocks

The performance of copper and gold is intricately linked to cyclical stocks, exhibiting a correlation of 76%. Cyclical industries, such as manufacturing, construction, automotive, heavy machinery, and infrastructure development, are heavily influenced by the overall economic cycle. During periods of economic prosperity, these industries thrive, while economic downturns pose challenges for them. Copper, being closely associated with economic growth, is often used as a leading indicator of economic health. An increase in copper prices and demand signals optimism regarding future economic growth. Conversely, gold’s performance is driven by factors such as central bank policies, inflation and currency fluctuations (particularly in the context of a weak dollar), economic and political instability, and investor sentiment.


Gold’s Strengths

Gold, traditionally regarded as an inflation and war hedge amongst investors, has regained its appeal as such due to recent developments. Central banks, grappling with historically high and persistently sticky inflation, have raised interest rates to curb rising prices. Additionally, ongoing geopolitical tensions, including the war in Ukraine, escalating China-Taiwan tensions, and deteriorating relations with Western nations, have heightened economic and political instability to levels not witnessed in recent times. These factors have significantly favoured gold investors, as the precious metal is perceived as a ‘safe haven’ in times of uncertainty.


Summary

In brief conclusion, the substantial underperformance of copper compared to gold can be attributed to the global economic climate and the nature of the commodities themselves. Copper’s price movements are closely tied to economic growth and investor sentiment, making it susceptible to the prevailing uncertainties. On the other hand, gold’s performance is driven by a range of factors, including central bank policies, inflation, geopolitical tensions, and investor sentiment. Given the present economic landscape characterized by uncertainty, high inflation, and geopolitical risks, gold has outperformed copper and lived up to its status as an inflation and war hedge, at least for the time being. These findings highlight the importance of analysing the drivers behind commodity price movements and considering the broader economic and geopolitical context when making investment decisions.


Sources:

S&P GSCI Total Return Performance & Stats (ycharts.com)

https://ycharts.com/indicators/gold_price_london

RefinitvData/Hottinger (ABRDN Physical Gold x WisdomTree Copper x Wisdomtree Silver x Crude Spot Price)

RefinitivData/Hottinger Gold Spot Price – 5yr


S&P GSCI Total Return Performance & Stats (ycharts.com)

https://www.bullionbypost.co.uk/price-ratio/gold/silver/10year/

https://www.xe.com/currencyconverter/convert/?Amount=1&From=USD&To=GBP

LME Copper | London Metal Exchange

Chart of the Week: US Closes In On Debt Ceiling, Potential for Default Rises

Author: Tim Sharp

Researcher: Jack Williams

Published: May 16, 2023

As anxiety spreads among investors, the cost of insuring against a possible U.S. credit default has surged to its highest level in more than ten years, surpassing levels observed in early 2009. This surge is a result of the United States coming closer to the brink of a potential default or breach of its debt ceiling.

Shown on the below chart, the United States has reached the level of its debt ceiling following a rapid rise in borrowing from 2017, partially worsened by the pandemic and knock on measures the country had to take to keep the economy alive such as their mass Stimulus Payments scheme.

Yesterday, US Sovereign CDS (Credit Default Swaps) rose again to 74 basis points according to Bloomberg Global Market Data, up from 73 points on the previous day’s close (+1.34%), and the highest level traded since March 2009.

A credit default occurs when a borrower is unable to meet its debt obligations, causing a default on its loans. In the case of the United States, a default would mean that the country would be unable to repay its debt, which would have severe consequences for the global financial system. Given that the United States is one of the largest borrowers in the world, a default could potentially trigger a major crisis, and could even lead to a sharp increase in borrowing costs, and a potential drop in the value of the U.S. dollar.

In order to protect themselves from the risks of a potential default, investors buy credit default swaps (CDS), which are financial instruments that act like insurance policies against default. A CDS pays out in the event of a default, providing investors with compensation for the losses they may incur.

The surge in the cost of CDS indicates that investors are becoming increasingly worried about the United States’ ability to meet its debt obligations. The cost of insuring against a potential default has risen significantly, suggesting that investors believe that the likelihood of a default is increasing, however it is worth noting that the overall probability of a US default is less than 6% over the next 5 years.

Substantial evidence of market stress linked to the tensions surrounding the debt ceiling have already begun to appear. Such has been seen recently by the significant increase in yields on Treasury bills that are set to mature around the X-date (Potential Default Date), resulting in higher borrowing costs for the government and consequently, for taxpayers as well. Figure 2, depicted below, clearly shows this trend. Since mid-April, there has been a near 1 percentage point increase in yields on short-term Treasury bills, which is nearly a 20% move from where yields previously stood. US Treasury Secretary Janet Yellen has been trying to raise the alarm, she says the potential default could happen as soon as June 1st.

When asked to speak to the potential outcomes of a default on US debt, the White House points to the written piece on their default which includes a study on the risks of a protracted default. A simulation ran by the CEA showed an immediate, sharp recession to the magnitude not seen since the great recession (2007-2009). In 2023 Q3, the first full quarter following the simulated debt ceiling breach, the simulation showed a 45% drawdown in the stock market, while consumer and business confidence takes a substantial hit. Unemployment was modelled to increase by 5 percentage points as consumption cuts take place.

Moody’s recently undertook a similar study using their own model, which predicted under a clean debt ceiling breach job growth continues northbound adding 900,000 jobs. Although under a protracted default situation, the modelled job losses amount to almost 8 million, which would be even further unemployment than The White House is forecasting within their own.


https://www.whitehouse.gov/wp-content/uploads/2023/05/DL-Figure-1.3.png

https://www.whitehouse.gov/wp-content/uploads/2023/05/Debt-Limit-Blog_Figure2.png


Figure 1 – https://www.crfb.org/papers/qa-everything-you-should-know-about-debt-ceiling

Figure 2 – https://www.whitehouse.gov/cea/written-materials/2023/05/03/debt-ceiling-scenarios/#_ftn1

Figure 3 – https://www.whitehouse.gov/wp-content/uploads/2023/05/DL-Figure-1.3.png

Figure 4 – https://www.whitehouse.gov/wp-content/uploads/2023/05/Debt-Limit-Blog_Figure3.gif

Datapoints/charting – Bloomberg Global Market Data / Refintiv Data


Chart of the Week: Lithium’s Lacklustre 2023 Performance

Author: Tim Sharp

Researcher: Jack Williams

Published: April 27, 2023

Demand for the mineral and the products it can produce has arguably never been higher, however the raw spot price of Lithium Carbonate, the preferred form of lithium for uses such as EV Batteries and grid storage has plummeted in recent months, losing nearly two thirds of its value.

As the global energy landscape evolves and the demand for renewable energy solutions and electric vehicles increases, Lithium has emerged as a key part of the energy transition towards sustainability. Amongst its forms, Lithium with its high energy density has gained significant attention in recent years as an opportunity for investors wishing to play the green transition within their portfolios. Lithium Carbonate, the lithium form of choice for EV battery builders and energy storage systems due to its purity and being amongst the highest of energy densities within the metals, has been watched closely in recent months as prices retreat from it’s all time high of 597,500 CNY/Tonne to below 175,000 CNY.

Recently Bloomberg released a study forecasting the Global Lithium Supply and Demand through to 2030, in which they predicted Lithium Demand to more than triple by the end of the decade with government programmes phasing out the production of traditional ICE (Internal Combustion Engine) based cars and transport, along with an increased prioritisation towards the storage of the energy generated from renewable sources such as wind farms that has been seen in recent years. Other bullish drivers considered within the Bloomberg study included enhanced customer adoption and interest around lithium-based transport, increased milage/battery pack sizes, increased lithium content in chemistries and real-world energy cell densities increasing. All of which would be positive for lithium in the longer term, or one would think so.

For Lithium investors, recent months have been disheartening to say the least, while EV bulls have rejoiced at the prospect of the lower costings for the most expensive part of the car to produce going forward. For Longer range EV’s, as much as $20,000 or £16,099 of the price tag of an EV comes from the cost of the battery.

Many investors are wondering with such a strong long-term story, why has Lithium has been hit so hard in recent months?

On the demand side, this can be explained by a less bullish sentiment around EV’s in China as a decade long EV subsidy programme winds down in addition to the extended Lunar New Year celebrations which eroded the sales of new cars at the turn of the year.

Lithium Analysts such as Fastmarket’s Jordan Roberts side with the theory of markets waiting to see the impact from lower consumer subsidies and consumer confidence data, which is currently tied to the country’s property crisis. By subsidising EV’s to price parity with conventional ICE cars, the country experienced a huge swathe of growth in its EV market, most recently at a rate of 90% in 2022. Dutch ING Groep formed a similar thesis in late February when they said “the fiscal burden has risen, and the government may not want to spend on subsidies to boost consumption when the economy is recovering. After the fiscal driven spike over the past few years, EV sales will slow.”

In Mid-February, the worlds largest Lithium-Ion battery manufacturer CATL (Contemporary Amperex Technology Co., Limited) had started offering discounts on batteries sold to Chinese EV companies such as Nio and Xpeng showing the downturn in spot prices for the essential minerals involved in battery production. CATL held around 37% market share globally for EV makers.

While demand for lithium is somewhat impacted, many point to the supply side of lithium as being the main contributor to falling prices this year. Production and exploration of Lithium have increased over recent years, with miners motivated by high spot prices and limited supply levels, however this according to many institutions could be set to change as waves of fresh supply come online from facilities in China, Australia and Chile. Bank of America, JP Morgan and Morgan Stanley all forecast production increases of between 22% and 42% in 2023 alone. New supply is coming online at a roaring pace, while demand appears to remain relatively strong given its long-term prospects, supply surges and downstream overcapacity could bring lithium prices down further in the medium term.

Recent announcements in March have continued to drive down lithium prices as supply is unveiled in more jurisdictions globally, such as the first lithium deposit to be discovered in Iran’s mountain province of Hamedan, believing to hold over 9 million tonnes of lithium, equitable to around 10% of the world’s total proven deposits.  Discoveries of this size cause investors to reassess the total amount of lithium out in the world, and the price they are willing to pay for it. Scarcity drives prices, while abundances drive prices down in the same way as seen most other metals and commodities.

The question in many investors are pondering is with such a structural change emerging with Lithium and it’s strong future prospects, will these pockets of uncovered supply really put a dampening on the long term spot price or has the negativity amongst investors perhaps been overdone, with more use cases coming forward, can the scales of supply and demand equalise once again for Lithium as EV’s, Battery Storage and green energy increase in popularity and availability.


Sources:

https://internationalbanker.com/brokerage/why-are-lithium-prices-collapsing/

https://www.globalxetfs.com/funds/lit/#performance

https://www.wsj.com/articles/lithium-prices-are-down-cheaper-batteries-and-evs-could-follow-7a171fc0

https://internationalbanker.com/brokerage/why-are-lithium-prices-collapsing/

https://about.bnef.com/blog/will-the-real-lithium-demand-please-stand-up-challenging-the-1mt-by-2025-orthodoxy/

https://www.mining.com/web/lithium-in-china-may-be-bottoming-as-low-margins-hit-producers/

https://www.prnewswire.co.uk/news-releases/lithium-gold-rush-continues-as-demand-skyrockets-for-electric-vehicles-and-renewable-energy-301804482.html

https://www.fastmarkets.com/insights/lithium-supply-and-demand-to-2030


Chart 1: https://uk.investing.com/commodities/lithium-carbonate-99.5-min-china-futures-historical-data

Chart 2: Bloomberg NEF, Avicenne Global Lithium Supply & Demand Forecast Study (Bloomberg NEF)

Chart 3: Global X ($LIT) Lithium & Battery Tech ETF

Allocating to Alternatives in the New Era

By Alan Dunne, Archive Capital


2022 may prove to be a watershed year in markets, not just because it was the worst year in decades for fixed income. It was the year that demonstrated the limitations of the 60-40 model. The experience of seeing bonds and equities decline concurrently encouraged many investors to seek a more diversified asset allocation model with higher allocations to alternatives[i].


The Shifting Macro Landscape

A key reason for now considering alternative investments is the changed macro backdrop. Not only have we witnessed the highest level of inflation in decades and the fastest adjustment in US interest rates, COVID-19 and rising geopolitical tensions have raised the possibility of deglobalization and a realignment of global trade.

These shifts in geopolitics and capital market trends and in demographics, technology and resource utilisation, have prompted McKinsey to suggest that the global economy may be on the cusp of a New Era[ii], replacing what they call the Era of Markets of the last 40 years.

From an economic perspective the transition has been from a demand-constrained economy with disinflationary tailwinds to a supply-constrained economy with inflationary headwinds. That points to less palatable policy trade-offs for central bankers going forward and the potential for a new era of Great Volatility[iii] as Isabel Schnabel of the ECB has called it.


Building Robust Portfolios

A more volatile macro back drop supports the case for building a more robust portfolio with assets and strategies that can deliver returns in different environments. Maintaining a good balance between liquid and illiquid exposures may also be critical in managing capital and taking advantage of opportunities in a more volatile environment

The trend in recent years has been for private markets to be the first port of call when building alternatives allocations. Certainly, private equity, private credit, real estate, VC and infrastructure all have a place in a diversified portfolio.

However, when constructing portfolios it is important to look through to the underlying economic risks. A portfolio may look diversified with allocations to a range of different “buckets”, but economically it may be less diversified. Research from Bridgewater[iv] has shown that the typical institutional portfolio has a heavy bias to positive growth and low inflation.

Furthermore, as Sebastian Page highlights in “Beyond Diversification”[v] some seemingly diversifying assets and strategies may have a low correlation to equities in an equity bull market but become more positively correlated in times of stress when the economy turns down and liquidity dries up.


The Opportunity in Liquid Alternatives

The need to maintain liquidity while diversifying equity and duration risk point to liquid alternative investments as a particularly interesting option at the current juncture.

The range of liquid alternatives spans alternative assets such as gold and REITs to the range of trading and hedge fund strategies which are available with daily, weekly or monthly liquidity. Broadly speaking that includes much of the global macro trading universe, managed futures, market neutral strategies, volatility and tail risk strategies.

An important attraction of liquid alternatives is the potential to deliver returns in periods when traditional assets underperform such as in 2022.

Certain features of these strategies equip them to do that, specifically:

  1. they are tactical (change positions in response to market and economic developments),
  2. unbiased and opportunistic (can be long or short),
  3. diversified (seek opportunities across many markets) and
  4. trade liquid markets.


Diversifying Equity Risk

Within liquid alternatives it is important to evaluate strategies not only on their risk-adjusted returns but also in terms of their ability to deliver a convex return profile in times of equity drawdown.

Some hedge fund strategies may have attractive risk adjusted returns but a high correlation to equity, such as currency or credit strategies, and so are less diversifying to equities. Other strategies such as equity market neutral can be uncorrelated to equities but won’t necessarily deliver positive performance in times of stress.

Strategies like global macro and managed futures may have lower risk adjusted returns than other hedge funds but have historically delivered positive returns in major equity drawdowns which can justify a higher allocation from a portfolio perspective.


Performance of Various Hedge Fund Strategies in Major Equity Drawdowns, 2000-2022

Source HFRI/Archive Capital

That said, global macro and managed futures strategies are diversifiers rather than insurance strategies and investors need to be clear on whether absolute return, uncorrelated returns or tail risk protection is the objective for any allocation.


Inflation Protection

In the last two decades investors could rely on government bonds to generate returns in times of equity stress. However, in 2022 we saw how that relationship is contingent on inflation being well behaved. Although the consensus is that inflation has peaked for now, it is conceivable that we may see renewed inflationary upswings and diversifying inflation risk is likely to continue to be a consideration.

Over the long term equities and real assets should provide inflation protection but these assets can be marked down if interest rates rise in response to higher inflation. Again, some liquid alternatives can  serve as potential diversifiers for inflation risk. In a paper in 2021 researchers at Man AHL[vi] examined which assets and strategies performed best in inflationary periods. They found that within equities, Quality outperformed, and elsewhere gold, commodities and trend following strategies did well. The research proved timely because Commodity Trading Accounts, or CTA’s, performed strongly in 2022.


Summary

In sum, the changed macro environment suggests the era of beta investing of the 2010s may be over and the traditional negative correlation between bonds and equities may be less stable.

A more volatile macro backdrop argues in favour of building more robust, resilient portfolios with greater use of alternatives.

While private markets may offer interesting opportunities to enhance equity and growth risk in portfolios, adding liquid alternatives can add diversifying sources of return, particularly in a more volatile macroeconomic environment.


Alan Dunne is the Founder and CEO of Archive Capital. Prior to founding Archive Capital, he was Managing Director and a member of the investment committee at Abbey Capital. In total, he has worked in the financial markets for over 25 years at hedge funds and investment banks as a CIO, hedge fund allocator, macro strategist, and technical analyst.

About Archive Capital

Archive Capital is a boutique alternative investments and investment research firm focused on the use of alternative investments in asset allocation.  We work with investors looking to source, evaluate and allocate to liquid alternative diversifying strategies.


[i] Move Over, 60/40 Portfolio. You’re Out of Date Now, Lauren Foster, Barrons, May 2022

[ii] On the Cusp of a New Era, McKinsey Global Institute, October 2022

[iii] Monetary Policy and the Great Volatility, Isabel Schnabel, Speech at Jackson Hole, August 2022

[iv] Building A Beta Portfolio in an Environment That Looks Difficult for Assets, Gordon et al, Bridgewater Associates, May 2022

[v] Beyond Diversification: What Every Investor Needs To Know About Asset Allocation, Sebastian Page, 2020

[vi] The Best of Strategies for Inflationary Times, Neville et al, The Journal of Portfolio Management, August 2021