

Author: Tim Sharp
Researcher: Jack Williams
Published: August 9, 2023
In the past, companies were often rewarded for meeting or exceeding analyst projections, and investors would respond positively to earnings reports. However, recent earnings periods have been far from the norm, characterized by exacerbated moves in both the up and downside as shifts in market themes and uncertain macro backdrops collide, leading to increased volatility. This is particularly evident in the current earnings season, where companies missing expectations or issuing lacklustre guidance are being heavily punished by the market.
Earnings Reactions:
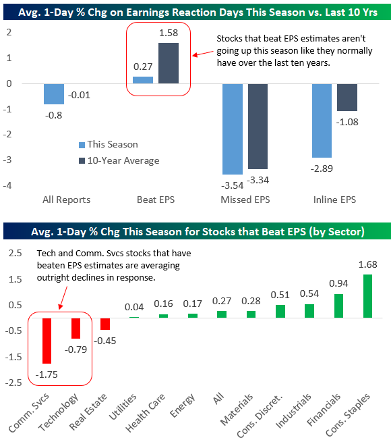
The chart in Figure 1 illustrates the stark contrast between companies beating estimates and underachievers in the market. The average one-day percentage change as a reaction to earnings over the last ten years has been negligible at -0.01%. However, in the current earnings season, this figure has dropped to -0.8%, indicating a significant difference from the historical average.
Source: Bespoke Investment Group
Moreover, the average reaction to Earnings-Per-Share beats in the past was a positive 1.58%, leading to an increase in share prices. In contrast, the current earnings season has shown an average reaction of only +0.27%, considerably lower than the historical average. Companies missing EPS revisions also saw slightly worse reactions this earnings season, with an average drop of -3.54%, compared to -3.35% over the last ten years. Companies meeting expectations are also experiencing more negative reactions, with an average decline of -2.89%, reflecting investors’ preference for outperforming businesses amidst the current uncertain macro environment.
Real Estate has struggled due to a weak macro backdrop for housing, even for those companies beating EPS, with an average decline of -0.45%. Technology also faced challenges as heightened expectations during earnings season, driven by the tech/AI-led rally in US stocks, pushed valuations to previously high pandemic territory once again. This resulted in an average reaction of -0.79% to a positive EPS beat within the sector. Communication Services also struggled in this earnings season, affected by weaker business sentiment, lower consumer confidence, and market stories such as lead cable contamination, which led to shares, such as AT&T, hitting 30-year lows.
Short Interest Effect:
Source: Goldman Sachs
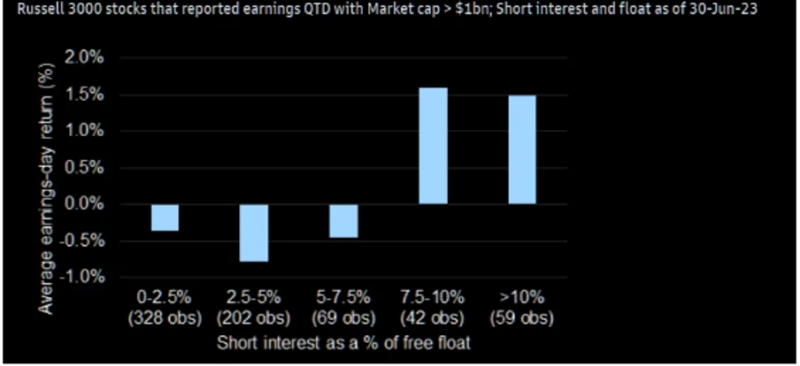
Data from Russell 3000 earnings suggests that short interest may be playing a significant role in earnings reactions. Stocks with short interest as a percentage of free float at over 7.5% posted earnings day returns of at least 1.5% on average, with 7.5%-10% being the sweet spot, producing +1.6% returns on earnings day compared to negative average returns for stocks with less than 7.5% short interest as a percentage of free float.
Conclusion:
The recent earnings season has been marked by increased volatility, with companies facing heightened scrutiny for their performances. Market themes and macroeconomic uncertainties have played a significant role in shaping investors’ reactions to earnings reports. Sector-specific challenges have also impacted reactions, with the Real Estate, Technology, and Communication Services sectors facing difficulties.
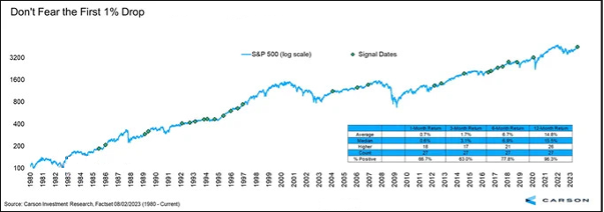
While this can be confusing and perhaps points to potential weakness around future earnings periods during times of uncertainty and macro inconsistence, this may not be the case. As nerves reemerge following a monster rally in the US year to date and the first 1% drop in the US Blue Chip Index in over two months, data from similar situations points the opposite direction as the typical outcome.
The chart below shows US500 performance after the first 1% drop in more than two months, which on average yields investor returns of 14.8% one year later. Obviously, nothing is guaranteed, but as the old saying goes, history tends to repeat itself, which I’m sure in this case, should it happen, would be warmly welcomed by many investors.
Source:Carson Investment Research
Sources:
Investment Group, B. (n.d.). Bespoke Daily 📊 – No Love for Beats. [online] us11.campaign-archive.com. Available at: https://mailchi.mp/bespokepremium/bespokes-morning-lineup-553274?e=33d57ea167.
Detrick, R. (2023). Volatility Is The Toll We Pay. [online] Carson Group. Available at: https://www.carsongroup.com/insights/blog/volatility-is-the-toll-we-pay/
Anon, (n.d.). S&P 500 Stocks – Average Earnings Day Moves – ISABELNET. [online] Available at: https://www.isabelnet.com/sp-500-stocks-average-earnings-day-moves/
The Market Ear. (2023). The Market Ear | Live news, analysis and commentary on what moves markets and trading. [online] Available at: https://themarketear.com/newsfeed
THE SHORT AND LONG OF RECENT VOLATILITY. (n.d.). Available at: https://www.goldmansachs.com/intelligence/pages/gs-research/the-short-and-long-of-recent-volatility-f/report.pdf
Our investment strategy committee, which consists of seasoned strategists and investment managers, meets regularly to review asset allocation, geographical spread, sector preferences and key global market drivers and our economist produces research and views on global economies which complement this process.
Our quarterly report presents our views on the world economic outlook and equity, fixed income and foreign exchange markets. Please click the link to download.