

Author: Tim Sharp
Researcher: Jack Williams
Published: June 14, 2023
The year of 2023 has been an anomaly for many reasons, perhaps the main one being the extreme concentration within equity markets, especially within recent months. Defined here as the concentration of top 10 leaders to the three-month performance of the US500, is above the 99th percentile over the past 30 years.
Shown below in figure one, you can see in light blue the weighting of the top ten leaders within the US500, and in dark blue the contribution of those top ten leaders.
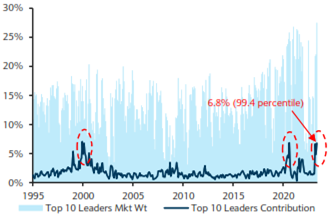
Figure 1-Refinitiv Data / Barclays Research
| Stock | Weighting | YTD Performance | PE Ratio |
| Apple (AAPL) | 7.50 | +46.57% | 31.14 |
| Microsoft (MSFT) | 6.7 | +39.53% | 36.23 |
| Amazon (AMZN) | 3.1 | +47.59% | 307.09 |
| Nvidia (NVDA) | 2.6 | +186.57% | 213.19 |
| Alphabet (GOOGL) A | 2.203 | +38.95% | 27.96 |
| Tesla (TSLA) | 1.846 | +139.32% | 76.17 |
| Alphabet (GOOG) C | 1.7737 | +38.72% | 28.09 |
| Meta Platforms | 1.658 | +117.51% | 34.63 |
| Berkshire Hathaway (BRK.B) | 1.651 | +8.54% | N/A |
| United Health Group | 1.26904 | -5.27% | 22.47 |
Since the mid 1990’s there has only been two instances with comparable levels of concentration, the first being the 2000 dot com bubble, and the second being the 2020 Covid rebound, both opposites in terms of outcomes for the market.
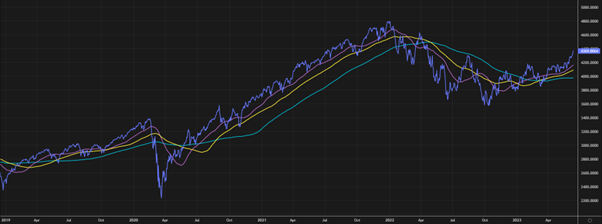
Figure 4 – 2020 Covid Rebound (Refinitiv Data)
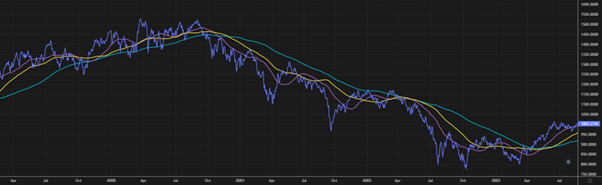
Figure 5 – Dot-Com Market Low (Refinitiv Data)
During the 2020 Covid Rebound, the market ripped higher by +20% while the top ten underperformed the US500 remaining flat for the first 9 months. Following this nine month period, the US500 rallied further instead being led by the top 10 stocks. 10 Leaders rallied +33% while the US500 ripped higher by 15%, highlighting the dramatic outperformance in this period by the top 10 names.
Market participants are currently weighing up which scenario, 2020 rebound or dot com era misery will prevail. With the debate amongst institutions continuing, recently several houses have been making their views known as to whether they view the latest rally as worth participating in.
Barclays equity strategists commentary has been increasing in positivity recently regarding the US main market. Within a research note issued by Barclays on the 13th of June entitled “Equity Options Not Pricing for Any Surprises”, strategists issued the firms belief the current situation is closer to that seen in the Covid rebound, with the main reasoning being the dramatic difference in valuation multiples seen in the Dot Com period compared to the current market, which although higher than where a bull market typically starts are still a long way from the lofty multiples being touted in the 2000’s period.
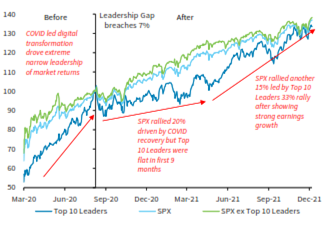
Figure 2 – Refinitiv / Bloomberg / Barclays Research
It is worth however noting that a bear market historically has not bottomed at multiples seen currently in these markets. The most expensive bear market low to date was the US500 following the dot-com bust, in which US500 PE’s stood at 13.5 times. The second most expensive bear marker bottom was the covid rebound in 2020 where earninsg stood at 13.5 times earnings.
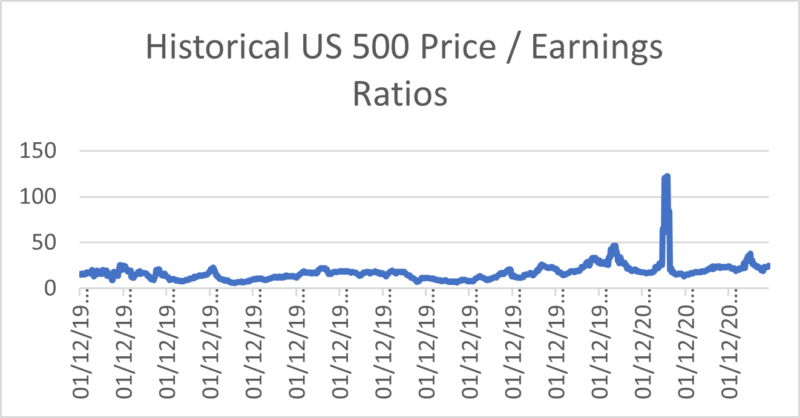
Figure 3 – Refinitiv / Hottinger Investment Management
Morgan Stanley, on the other hand, are much more bearish in their forecast. With the US500 rally now crossing the 20% threshold, many are declaring the bear market officially over. Morgan Stanley are not in this camp, quite the opposite infact. M.S are predicting a V shaped earnings recession/recovery within their forecasts.
Over 70% of the US500’s industry groups grew forward earnings expectations by 20% above pre covid levels. Morgan Stanley’s forecast of earnings stand well below current consensus. Even being so far below consensus would still put their figures 10% above the long term earnings trend line.
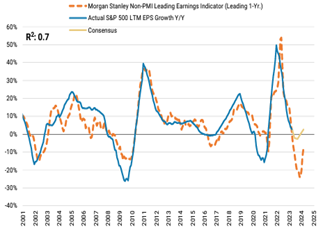
Figure 6 – M.S Earning Model Suggest Earning Recession Is Not Over (FactSet / Morgan Stanley)
While their forecast was lower than consensus even 6 months ago, the spread between MS and consensus has widened further while the street and buy side have raised their consensus for earnings over recent months.
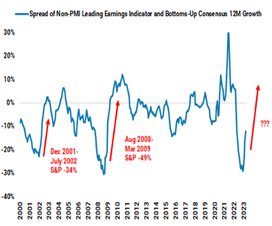
Figure 7 – Spread Between Morgan Stanley Model & Consensus Rarely Been Wider (FactSet / Morgan Stanley)
Rather than looking at similar rallies or period of concentration, M.S are looking at the variables that led us to our current situation and when similar variables such as Fed hiking cycles, sticky inflation and build up of savings occurred in the past.
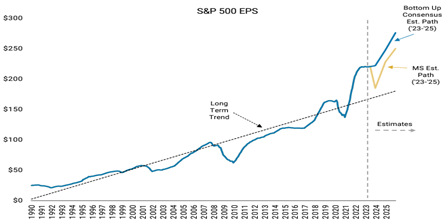
Figure 8 – M.S Base Case EPS Estimate Still Above Long-Term Trend (FactSet / Morgan Stanley)
Perhaps the most notable period, and which Morgan Stanley have chosen to focus on is the post WWII period. This was similar in a way where excess savings were built up and unleashed into the economy during a supply constrained environment, where inflation surges as a result.
In this case asset prices surged to prior cycle highs at a historically rapid pace. The boom in inflation and earnings lef to the Fed tightening at the fastest rate in 40 years… Sound familiar?
The boom and fed reaction caught many investors off guard, with M.S expecting many to be surprised once again by the depth of their forecasted earninings recession with the sharp V shaped recovery they forecast in 2024.
Referencing:
Research, B., Gupta, A., Pascale, S., Kang, V. and Dass, R. (2023). “Equity options not priced for any surprises ahead of heavy macro week” .
Barclays Research, Barclays Research / Barclays Live: Barclays Research , pp.1–7.
www.macrotrends.net. (n.d.). S&P 500 PE Ratio – 90 Year Historical Chart. [online] Available at: https://www.macrotrends.net/2577/sp-500-pe-ratio-price-to-earnings-chart.
Ward, S. (2022). Why Stock Multiples Say the Market Could Continue to Drop. [online] Morningstar, Inc. Available at: https://www.morningstar.com/markets/why-stock-multiples-say-market-could-continue-drop.
Slickcharts (n.d.). S&P 500 Companies – S&P 500 Index Components by Market Cap. [online] www.slickcharts.com. Available at: https://www.slickcharts.com/sp500.
Wilson, M.J., Pauker, A.B., Weaver CFA, M.M., Ding PHD, D. and Lentini, N. (2023). Weekly Warm-Up: The Bear Is Still Alive Based on Our Boom/Bust Framework. Morgan Stanley Research: Morgan Stanley Research.
Statista. (2023). Europe: PE multiples technology & telecommunications 2022. [online] Available at: https://www.statista.com/statistics/1028379/price-earnings-in-the-technology-and-telecommunications-sector-in-europe/.
Our investment strategy committee, which consists of seasoned strategists and investment managers, meets regularly to review asset allocation, geographical spread, sector preferences and key global market drivers and our economist produces research and views on global economies which complement this process.
Our quarterly report presents our views on the world economic outlook and equity, fixed income and foreign exchange markets. Please click the link to download.