

Author: Tim Sharp
Researcher: Jack Williams
Published: May 16, 2023
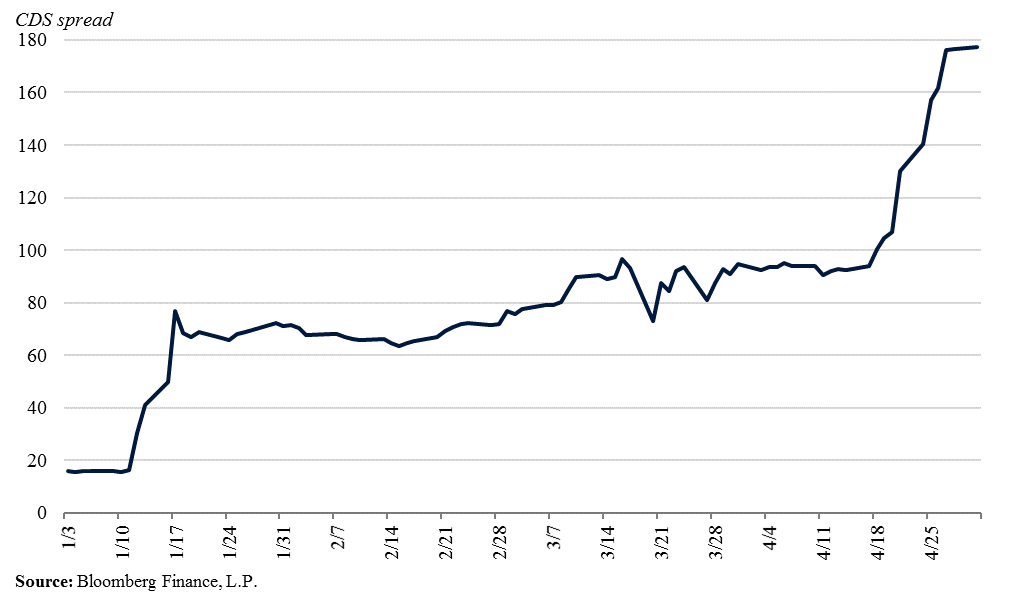
As anxiety spreads among investors, the cost of insuring against a possible U.S. credit default has surged to its highest level in more than ten years, surpassing levels observed in early 2009. This surge is a result of the United States coming closer to the brink of a potential default or breach of its debt ceiling.
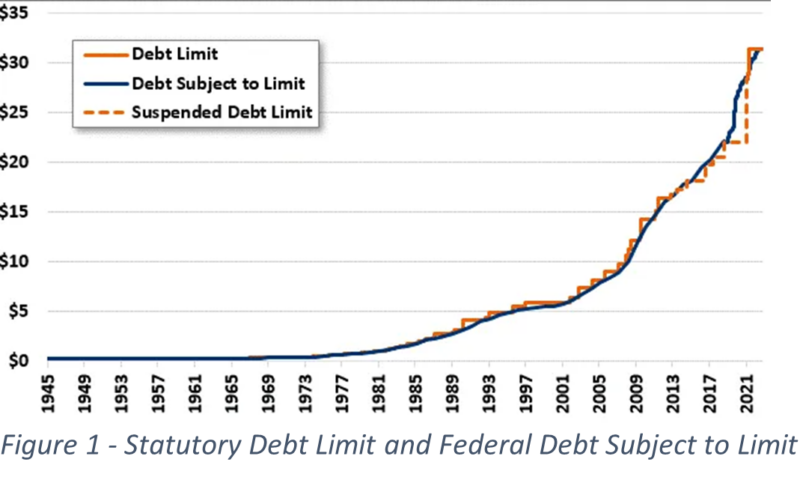
Shown on the below chart, the United States has reached the level of its debt ceiling following a rapid rise in borrowing from 2017, partially worsened by the pandemic and knock on measures the country had to take to keep the economy alive such as their mass Stimulus Payments scheme.
Yesterday, US Sovereign CDS (Credit Default Swaps) rose again to 74 basis points according to Bloomberg Global Market Data, up from 73 points on the previous day’s close (+1.34%), and the highest level traded since March 2009.
A credit default occurs when a borrower is unable to meet its debt obligations, causing a default on its loans. In the case of the United States, a default would mean that the country would be unable to repay its debt, which would have severe consequences for the global financial system. Given that the United States is one of the largest borrowers in the world, a default could potentially trigger a major crisis, and could even lead to a sharp increase in borrowing costs, and a potential drop in the value of the U.S. dollar.
In order to protect themselves from the risks of a potential default, investors buy credit default swaps (CDS), which are financial instruments that act like insurance policies against default. A CDS pays out in the event of a default, providing investors with compensation for the losses they may incur.
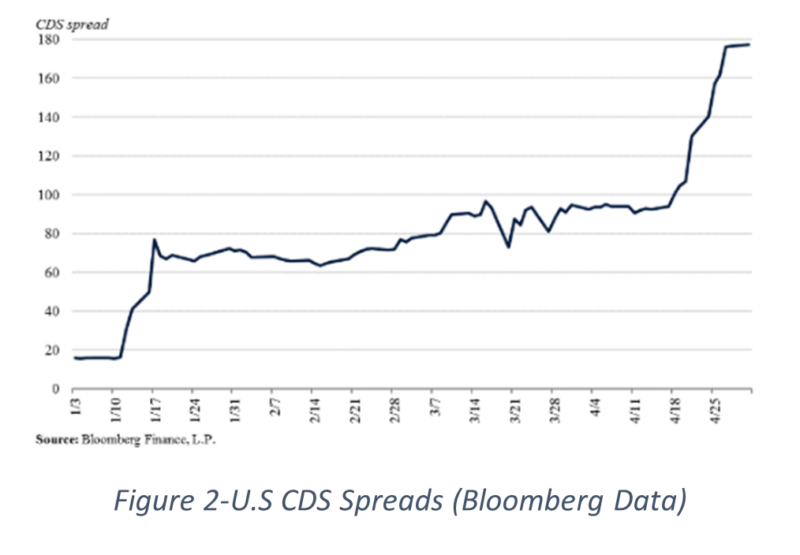
The surge in the cost of CDS indicates that investors are becoming increasingly worried about the United States’ ability to meet its debt obligations. The cost of insuring against a potential default has risen significantly, suggesting that investors believe that the likelihood of a default is increasing, however it is worth noting that the overall probability of a US default is less than 6% over the next 5 years.
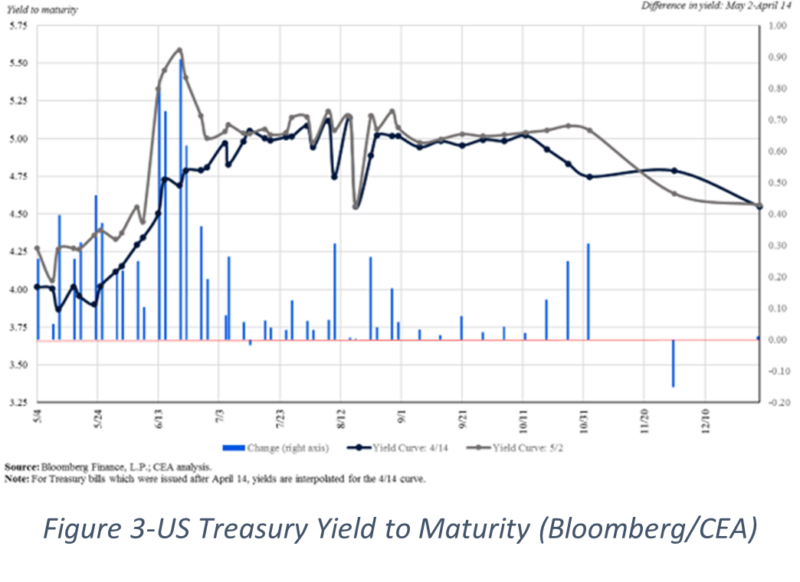
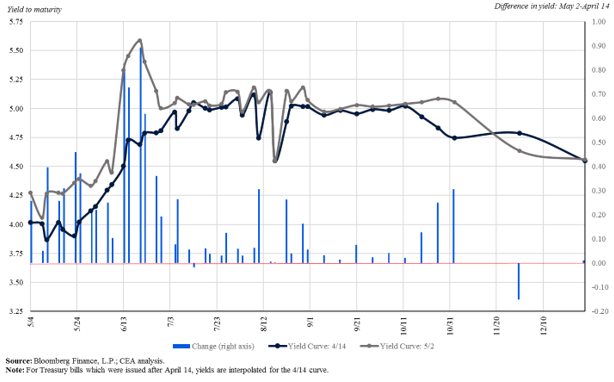
Substantial evidence of market stress linked to the tensions surrounding the debt ceiling have already begun to appear. Such has been seen recently by the significant increase in yields on Treasury bills that are set to mature around the X-date (Potential Default Date), resulting in higher borrowing costs for the government and consequently, for taxpayers as well. Figure 2, depicted below, clearly shows this trend. Since mid-April, there has been a near 1 percentage point increase in yields on short-term Treasury bills, which is nearly a 20% move from where yields previously stood. US Treasury Secretary Janet Yellen has been trying to raise the alarm, she says the potential default could happen as soon as June 1st.
When asked to speak to the potential outcomes of a default on US debt, the White House points to the written piece on their default which includes a study on the risks of a protracted default. A simulation ran by the CEA showed an immediate, sharp recession to the magnitude not seen since the great recession (2007-2009). In 2023 Q3, the first full quarter following the simulated debt ceiling breach, the simulation showed a 45% drawdown in the stock market, while consumer and business confidence takes a substantial hit. Unemployment was modelled to increase by 5 percentage points as consumption cuts take place.
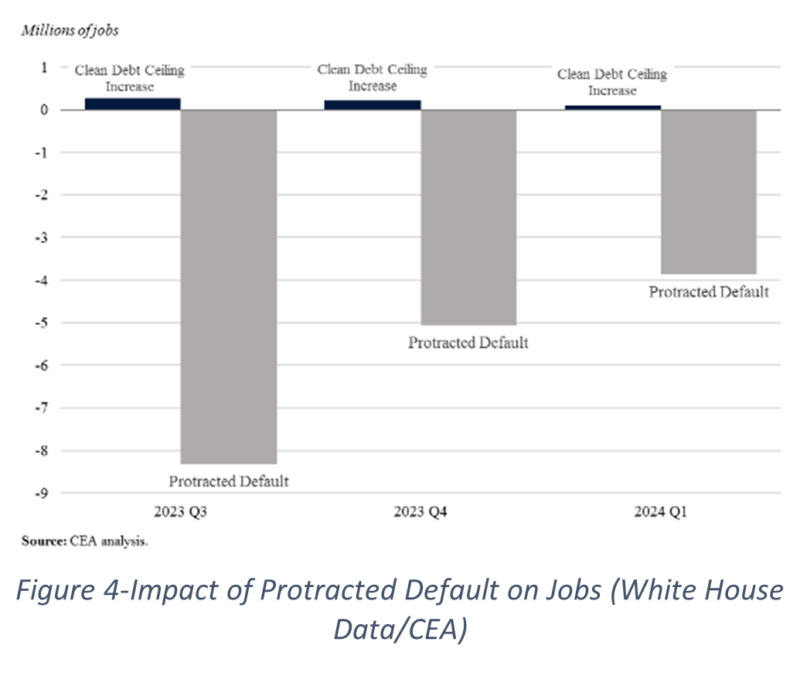
Moody’s recently undertook a similar study using their own model, which predicted under a clean debt ceiling breach job growth continues northbound adding 900,000 jobs. Although under a protracted default situation, the modelled job losses amount to almost 8 million, which would be even further unemployment than The White House is forecasting within their own.
https://www.whitehouse.gov/wp-content/uploads/2023/05/DL-Figure-1.3.png
https://www.whitehouse.gov/wp-content/uploads/2023/05/Debt-Limit-Blog_Figure2.png
Figure 1 – https://www.crfb.org/papers/qa-everything-you-should-know-about-debt-ceiling
Figure 2 – https://www.whitehouse.gov/cea/written-materials/2023/05/03/debt-ceiling-scenarios/#_ftn1
Figure 3 – https://www.whitehouse.gov/wp-content/uploads/2023/05/DL-Figure-1.3.png
Figure 4 – https://www.whitehouse.gov/wp-content/uploads/2023/05/Debt-Limit-Blog_Figure3.gif
Datapoints/charting – Bloomberg Global Market Data / Refintiv Data
Our investment strategy committee, which consists of seasoned strategists and investment managers, meets regularly to review asset allocation, geographical spread, sector preferences and key global market drivers and our economist produces research and views on global economies which complement this process.
Our quarterly report presents our views on the world economic outlook and equity, fixed income and foreign exchange markets. Please click the link to download.