

Author: Tim Sharp
Researcher: Jack Williams
Published: May 25, 2023
The 2011 debt ceiling issue was a significant event that unfolded in the United States, casting a shadow of uncertainty over the country’s financial stability. The dispute, primarily between the Obama administration and the Republican-controlled Congress, revolved around raising the federal debt ceiling to avoid defaulting on the nation’s financial obligations.
The debt ceiling is a statutory limit set by the US Congress on the amount of national debt the government can accumulate, which has been a major story in recent weeks as the US default probability rises, and the country nears their resolution deadline.
In 2011, the United States approached its debt ceiling of $14.3 trillion, leading to a heated political debate. Republicans demanded significant spending cuts and fiscal reforms in exchange for raising the ceiling, while the Obama administration argued for a “clean” increase without any attached conditions.
As we near the 2023 ‘X’ date of the 15th of June 23’ (the date interest payments on U.S debt are scheduled to be made, many institutions such as J.P Morgan, rather than looking forwards are looking backwards to 2011 to gain an idea of how the market might react should the U.S not come to a resolution in time.
Whilst many of the same names (JPM etc.) are cautiously optimistic that discussions between Biden and speaker McCarthy will produce at least a partial deal to either raise or suspend the debt ceiling, as we near the ‘X date’ the risk of default rises dramatically.
The chart below shows the probability of the U.S defaulting, and how the risk of default grows as the ‘X date’ nears. The blue line below shows the probability of default in 2011, as the U.S neared their X date a sharp uptick in risk of default appeared, rising to almost 6%.
The partial grey line follows the risk of a U.S default this year (2023) which has seen a sharp rise recently, similar to moves seen in 2011.
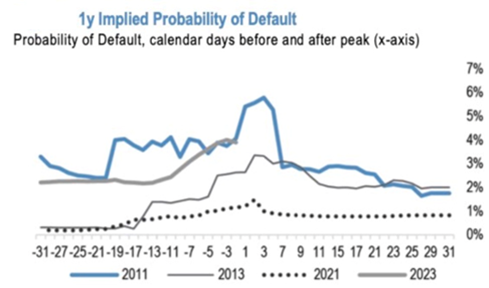
Figure 1 – J.P. Morgan Equity Macro Research, Bloomberg Finance L.P
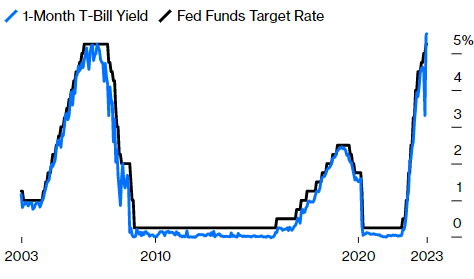
Figure 2 – Bloomberg Data
Figure 2 below shows short term 1-month T-Bill yields, which as of recent have spiked, suggesting increasing default concerns, a stark contrast to the rallies seen amidst US indices in recent weeks.
In times such as these where volatility is expected, one might expect to see flows into treasuries as investors look to take some risk off the table, however T-Bill have surprisingly traded in the opposite direction, now trading at yields in excess of those seen amidst the 08’ financial crisis.
In 2011, prolonged and contentious negotiations over the debt ceiling caused uncertainty to flood into financial markets, particularly within the U.S as investors worries about the prospect of a default. This led to increased volatility and heightened risk which lasted for nearly three trading months.
In the weeks leading up to the 2011 August 2nd deadline the market experienced significant swings. Throughout July 11’ all major US indices (DJIA, US500 and Nasdaq) witnessed substantial declines. The DJIA for example saw several days of triple digit losses, with the index shedding over two thousand points through a two-week period.
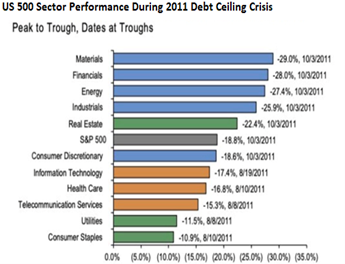
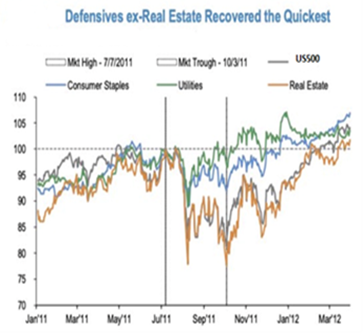
Figure 3 – J.P. Morgan / Bloomberg
During this time, the US 500 index declined by 17% with the brunt of the beating being felt by materials, financials, and energy, while defensive strategies excluding real estate outperformed.
Furthermore, to amplify market turmoil, ratings agency Standard and Poor’s downgraded the US sovereign credit rating from AAA to AA+, marking the first time in history the U.S lost its top tier credit rating.
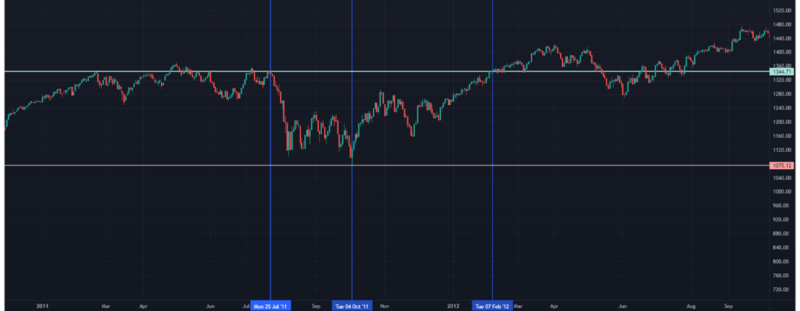
Figure 4 – SP500 (2011) TradingView
While there are clear differences between the 2011 debt debacle and the current issue, perhaps the largest being the Rate of Inflation and Fed Funds Rate (both of which were dramatically lower in 2011 than today) many lessons have been learned regarding why negotiations must be conducted and concluded swiftly. That being said, one cannot ignore the risk however small of a US default and its potential impact on markets.
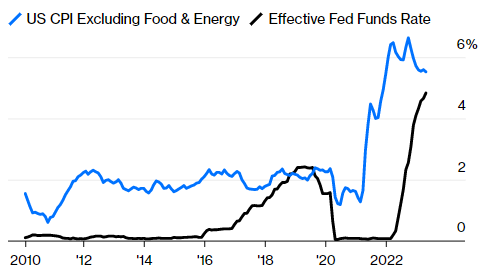
Figure 5 – Bloomberg Data
The U.S president Joe Biden has cancelled a planned visit to Australia and Papua New Guinea to focus on debt limit talks, with speaker McCarthy commenting that talks were productive in nature. It is true that the US has never defaulted on its payments before and the debt ceiling has been raised 78 times since 1960 under both republican and democrat presidents, although ex-president Trump is calling for a default as his preferred resolution.
On 26th April Republicans passed a bill in the house that would raise the debt ceiling by $1.5Tr but mandated $4.8Tr in spending cuts over a decade, although democrats have so far refused to negotiate spending cuts over the debt ceiling talks.
Negotiations are expected to resume Wednesday 24th with Republicans looking for some kind of guarantee on spending/budget caps and investors hoping for news regarding some sort of resolution.
Sources:
Asset Management , J.P.M. (2023). How Does the Debt Ceiling Progress From Here? | J.P. Morgan. [online] www.jpmorgan.com. Available at: https://www.jpmorgan.com/wealth-management/wealth-partners/insights/how-does-the-debt-ceiling-progress-from-here#:~:text=With%201Y%20CDS%20at%20a.
Authers, J. (2023). On X+1 Day, We Won’t Be Going Back to Normal. com. [online] 24 May. Available at: https://www.bloomberg.com/opinion/articles/2023-05-24/debt-deal-before-x-1-day-the-us-crisis-will-have-already-begun?leadSource=uverify%20wall.
Aratani, L. (2023). What is the US debt ceiling and what will happen if it is not raised? The Guardian. [online] 17 May. Available at: http://www.theguardian.com/business/2023/may/16/what-is-debt-ceiling-limit-explainer.
BGR Group (2021). History of Debt Limit and Why It Matters | BGR Group. [online] BGR Group. Available at: https://bgrdc.com/history-of-debt-limit-and-why-it-matters/.
Palumbo, A. (2023). Stock Market Today: Dow Drops, Premarket Movers, Debt Ceiling Talks, Fed Minutes, Bitcoin Falls, Nvidia Earnings, China Covid-19. [online] www.barrons.com. Available at: https://www.barrons.com/livecoverage/stock-market-today-052423?mod=article_inline.
P. Morgan (n.d.). Debt ceiling drama: What you need to know. [online] www.jpmorgan.com. Available at: https://www.jpmorgan.com/wealth-management/wealth-partners/insights/debt-ceiling-drama-what-you-need-to-know#:~:text=Today%2C%20that%20limit%20stands%20at.
Our investment strategy committee, which consists of seasoned strategists and investment managers, meets regularly to review asset allocation, geographical spread, sector preferences and key global market drivers and our economist produces research and views on global economies which complement this process.
Our quarterly report presents our views on the world economic outlook and equity, fixed income and foreign exchange markets. Please click the link to download.