

Author: Tim Sharp
Researcher: Jack Williams
Published: June 27, 2023
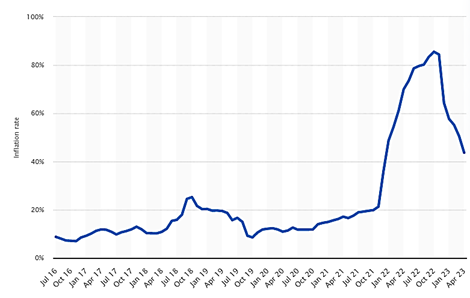
In a notable turn of events, the recent market rally in the United States has led to the erasure of the premium traditionally associated with owning shares in US companies. This phenomenon is particularly evident in the convergence of yields between cash, bonds, and equities. Currently, three-month Treasury bills offer a yield of 5.3% following a brief pause in interest rate hikes by the Federal Reserve, which has maintained the interest rate in the range of 5-5.25%. Although the central bank has hinted at a potential double increase in rates towards the end of the year, it remains uncertain.
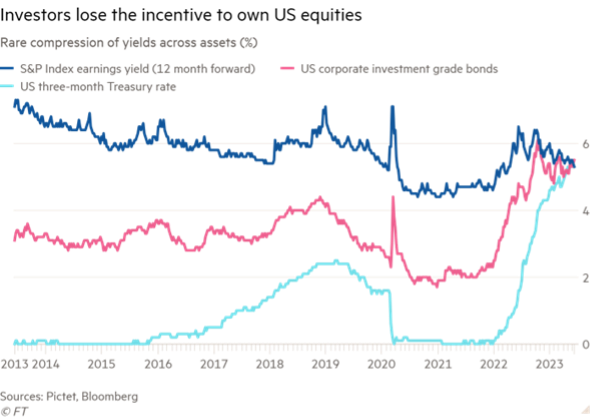
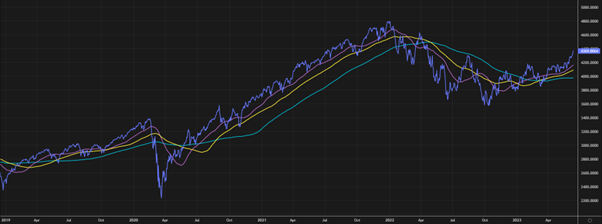
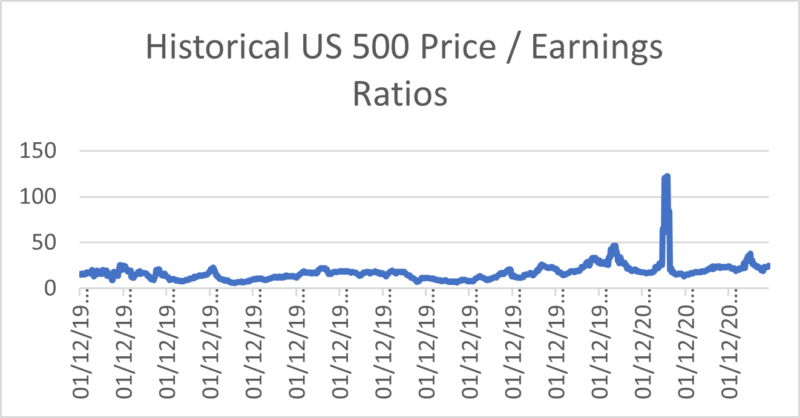
This convergence of yields across different asset classes is unprecedented in history. As depicted in the accompanying chart, the earnings yield of the US500 (S&P 500) now matches that of cash and bond yields. This is a significant departure from the situation less than six months ago, when the US500’s earnings yield exceeded 6%. The recent surge in US markets, primarily driven by the technology sector and semiconductor industry, has contributed to this decline in the earnings yield.
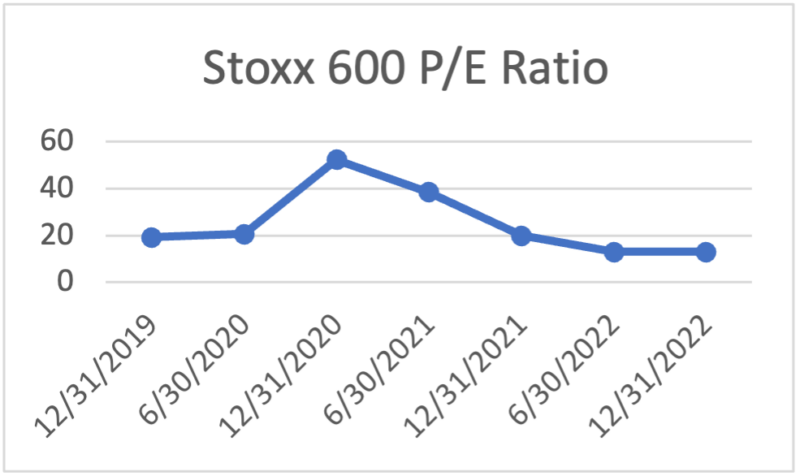
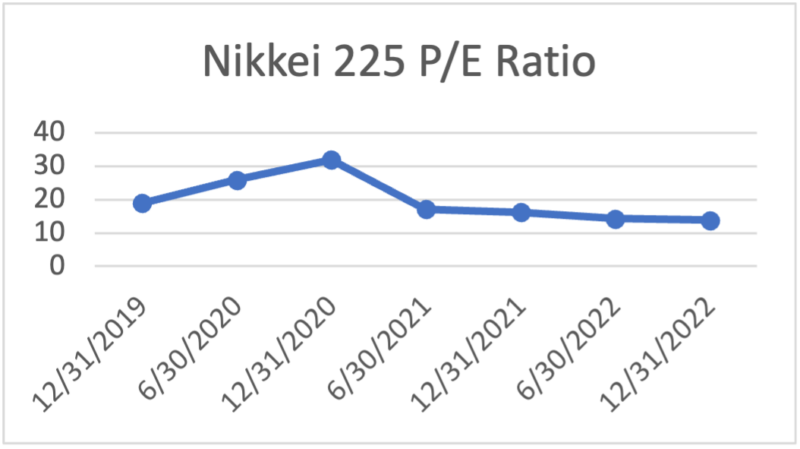
Comparisons between the price-to-earnings (P/E) ratios of the US500 index and its European counterparts have raised concerns amongst investors.
The US500 currently boasts a P/E ratio of 23 times earnings, 56% higher than the Stoxx 600’s valuation of 13 times earnings in Europe.
One explanation for this disparity lies in the differing sector composition between the two regions.
Europe has fewer companies operating in the technology and semiconductor sectors, which have been key drivers of the recent market rally. However, some asset managers, including Christian Kopf of Union Investment, argue that bonds offer US investors better risk-adjusted returns compared to the current state of the markets.
On the other hand, Pictet, another asset manager, is seeking alternative sources of alpha and identifies European and Asian equities as potentially outperforming their US counterparts in the latter half of the year.
This convergence of returns is not limited to equities and three-month treasuries; it also extends to investment-grade bonds and cash yields. According to a recent survey by Bank of America, investment-grade bonds are experiencing the highest overweight positioning since 2008, with a net allocation of +10% in this space.
In conclusion, the recent market rally in the United States has resulted with matched yields among cash, bonds, and equities, which is an unprecedented occurrence in history. The decline in the earnings yield of the US500 reflects the strong performance of US markets, driven by the technology sector and semiconductors, which has not been seen in the Eurozone area to the same extent. The disparity in P/E ratios between the US500 and European indices can be attributed to differences in sector composition to some extent, however, there has been a long-standing valuation gap between US markets and the EU and UK markets which many are wondering whether this could be a reason for such gap to narrow or close, however, that is yet to be seen.
Referencing
Bloomberg Data, Bloomberg Data. “Bloomberg – Asia Pacific Stocks.” Www.bloomberg.com, Bloomberg Financial Data, 21 June 2023, www.bloomberg.com/news/articles/2023-04-18/investors-turn-most-underweight-stocks-versus-bonds-since-2009#xj4y7vzkg. Accessed 21 June 2023.
Mosolova, Daria, and Mary McDougall. “Rate Rises Erode Investors’ Incentive to Hold US Companies’ Shares.” Financial Times, 18 June 2023, www.ft.com/content/79b7775a-fe35-4591-ae4a-cc31eea1c81c. Accessed 21 June 2023.
Research, Siblis . “P/E & CAPE Ratio of Nikkei 225 & Japanese Stock Market.” Siblis Research, 20. 2023, www.siblisresearch.com/data/japan-nikkei-pe-cape/. Accessed 21 June 2023.
Research Service, MacroTrends. “S&P 500 PE Ratio – 90 Year Historical Chart.” Www.macrotrends.net, 21 June 2023, www.macrotrends.net/2577/sp-500-pe-ratio-price-to-earnings-chart.
Reddy, Sam Moore, Rohan. “Global X 1-3 Month T-Bill ETF (CLIP).” Global X ETFs, 21 June 2023, www.globalxetfs.com/introducing-the-global-x-1-3-month-t-bill-etf-clip/. Accessed 21 June 2023.

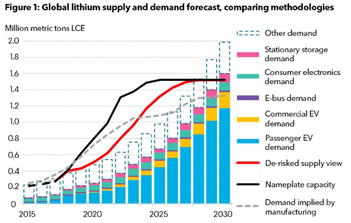


 The question in many investors are pondering is with such a structural change emerging with Lithium and it’s strong future prospects, will these pockets of uncovered supply really put a dampening on the long term spot price or has the negativity amongst investors perhaps been overdone, with more use cases coming forward, can the scales of supply and demand equalise once again for Lithium as EV’s, Battery Storage and green energy increase in popularity and availability.


