

by Tim Sharp, researched by Jack Williams
In the backdrop of this year’s notably narrow equity market performance, investors are meticulously scrutinising the latest earnings per share (EPS) estimates and revisions from analysts. This heightened vigilance stems from the increasing confluence of contradictory data, further exacerbating the intricacies of an already complex market backdrop. Even seasoned investors find themselves unsettled by these developments as underscored by the recent remarks of prominent investor and trader, Paul Tudor Jones. In a recent interview with CNBC, Jones said that the current geopolitical landscape presents an unprecedented and formidable challenge, characterizing it as potentially the most threatening and challenging environment he has ever encountered.
However, following a series of negative revisions earlier in the year, EPS estimates for Q3 2023 have remained relatively flat since august, holding steady into the print. The wider US market has fallen 4% over the same period.
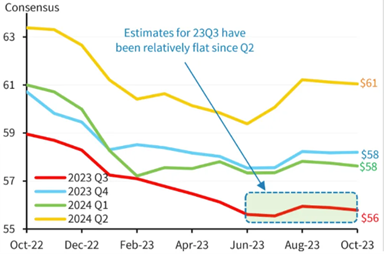
Figure 1: Refinitv Data, Bloomberg, Barclays Research
When looking at revisions, there is a widening disparity between big cap technology stocks and the rest of the market. Big cap technology EPS has been revised up 15% YTD while the remainder of the US500 blue chip index showing downward revisions of -6% YTD. In a particularly confusing fashion, there is a vast difference between Big Tech EPS revisions and those seen in the wider tech sector, of which are expected to decline by -6% alike the US500 index.
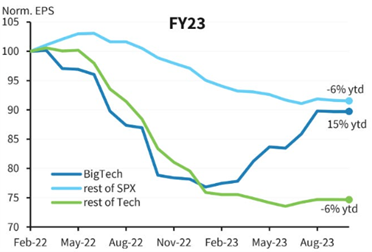
Figure 2: EPS Revisions 2024, Barclays
This gap in outlook continues into 2023 where big cap tech earnings are expected to rise by 17% compared to -3% for the wider US500 index and -4% for the wider technology sector.
As shown in the chart below, dispersion of analyst forecasts remains high for big tech, but has converged for the rest of the US500.
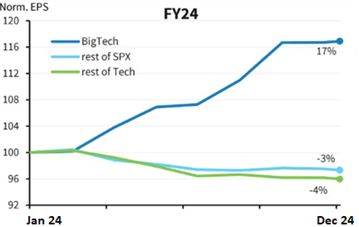
Figure 3:EPS Revisions 2023, Barclays
Depicted in the chart below, you can see the dispersion of analyst forecasts over the past 18 months. A gap in dispersion emerged, albeit narrow, in H1 23’. This was caused by a convergence of macro uncertainties, combined with upwardly revised tech estimates leading to the AI/Tech fuelled rally which pushed indices higher as companies like Nvidia upgraded their outlook. The rest of the market did not enjoy such an uplift, instead seeing downward revisions. Although the wider technology sector enjoyed positive revisions till May of 2023, the sector (ex-big tech) has seen revisions since, leading to the widened gap shown below.
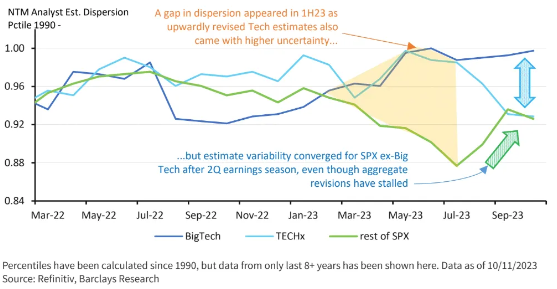
Figure 4:Dispersion of Analyst Forecasts (US500) Barclays
Bibliography
Chartbook, D. (2023). Daily Chartbook #303. [online] www.dailychartbook.com. Available at: https://www.dailychartbook.com/p/daily-chartbook-303
Squawk Box, C. (2023). CNBC Transcript: Tudor Investment Corporation Founder & CIO Paul Tudor Jones Speaks with CNBC’s ‘Squawk Box’ Today. [online] CNBC. Available at: https://www.cnbc.com/2023/10/10/cnbc-transcript-tudor-investment-corporation-founder-cio-paul-tudor-jones-speaks-with-cnbcs-squawk-box-today.html.
Research, B. (2023). Barclays Research – Food for Thought: A Convergence in Dispersion. [online] live.barcap.com. Available at: https://live.barcap.com/PRC/publication/CL_TEJ-IH4gfiB-IH4g_652824d5cc762f71f409aaee.
Research, B. (2023). Barclays US Equity Research – Food for Thought: A Divergence in Dispersion. [online] live.barcap.com. Available at: https://live.barcap.com/PRC/publication/CL_TEJ-IH4gfiB-IH4g_64b07d22a652195b94c79464.
Our investment strategy committee, which consists of seasoned strategists and investment managers, meets regularly to review asset allocation, geographical spread, sector preferences and key global market drivers and our economist produces research and views on global economies which complement this process.
Our quarterly report presents our views on the world economic outlook and equity, fixed income and foreign exchange markets. Please click the link to download.