by Tim Sharp
The markets’ wobble at the beginning of the month was well documented in our mid-month commentary. To recap, a mixture of softening economic data led investors to believe that the US Federal Reserve (Fed) was behind the curve, risking a hard landing. These concerns combined with the unwinding of the Yen carry trade, as the currency strengthened significantly following an unexpected rate tightening by the Bank of Japan (BOJ).
Two weeks later, headline CPI fell below 3%, the lowest inflation print since March 2021, and into the Fed’s target zone. Concurrently, many economists – such as Dr Torsten Slok of Apollo, via his Daily Spark note – pointed out signs of enduring strength in the US economy[i]:
“Looking at the latest daily and weekly data shows that retail sales are strong, jobless claims are falling, restaurant bookings are strong, air travel is strong, hotel occupancy rates are high, bank credit growth is accelerating, bankruptcy filings are trending lower, credit card spending is solid, and Broadway show attendance and box office grosses are strong.
The bottom line is that there are no signs of a recession in the incoming data,”
As we predicted, Fed Chair Powell used the Jackson Hole Symposium to underline the Fed’s view of the data and surprised many by his dovish speech. He unambiguously declared:
“The time has come for policy to adjust. The direction of travel is clear, and the timing and pace of rate cuts will depend on incoming data, the evolving outlook, and the balance of risks.”
With the Fed clearly believing that inflation is on a sustainable path back to 2%, and with employment data robust but related pressures having eased, the fundamentals for a soft landing are falling into place. As the month draws to a close, Fed Funds Futures are pricing in 100bps of cuts by year-end. With just three meetings remaining until year end, the question for September’s meeting is whether it will see a 25bps or 50bps cut.
The other major event for August was Nvidia’s results, after the market close on August 28th. These were expected to either underline the markets over-optimism in the roll-out of AI (Artificial Intelligence) or extend the run of ‘beat-expectations-and-raise-guidance’ results that investors had become so spectacularly used to receiving. The company reported a very strong second quarter: revenue growth of 122% year-on-year, earnings-per-share (EPS) growth of 152%, and expected third quarter revenue growth of 80%, all of which were higher than the average estimates. However, the results failed to beat the most optimistic of expectations which, combined with the continued slow roll-out of the new Blackwell chip, led to the shares being sold off 8% in after-hours trading, before closing approximately 6% lower the following day. This proves that merely beating expectations is insufficient for mega-tech momentum to continue, against a backdrop of optimistic valuations. Although the belief in the AI story remains, question marks over AI’s ability to generate wider returns through its usage are emerging.
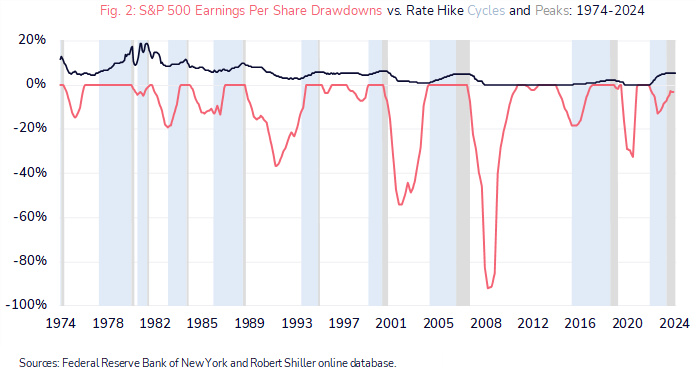
Following the sell-off at the beginning of the month, the equal-weighted S&P500 index regained its all-time high on August 21st, while the market-weighted index took a couple of days longer to do so and has since weakened into month end, following Nvidia’s results. This suggests to us that a broadening out of returns is underway, a contention that the latest earnings season has supported. With over 97% of the S&P500 having reported, aggregate earnings have beaten estimates by 5.6%, versus an historical average of 4.8%, with 74% of companies topping estimates. Second quarter revenues grew on average 5.2%, while EPS grew 11.6%. Although technology was by far the strongest sector, we feel these results reflect broad strength in the US economy and little sign of a looming recession[ii].
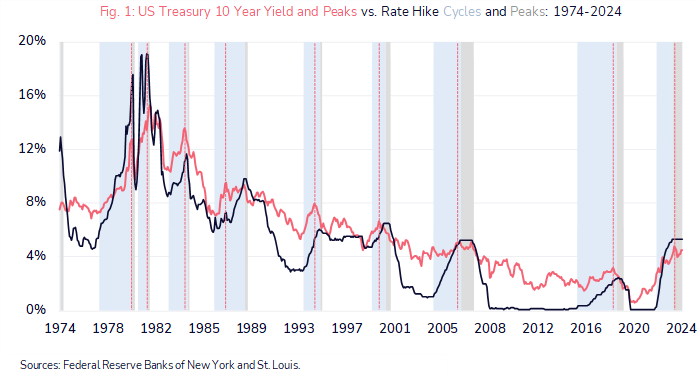
The pricing in of future interest rate cuts has also seen the US Treasury curve steepen, with 2-yr bond yields dropping 7 basis points to 3.90%, while 10-yr yields increased to 3.86%. As a result, the curve is inverted by only c. 4bps, which is the closest we have been to a dis-inversion for the last couple of years.
Turning to the UK, the Labour government is gearing up for the Autumn budget by taking the opportunity to announce a £22bn perceived “black hole” in the country’s finances and forewarn the need for tax rises. Investors are focusing on capital gains tax’s equalisation with income tax, which has caused alarm in the buy-to-let property market and in buy-and-hold investment portfolios. Inheritance tax and employer national insurance contributions are rumoured to be in the crosshairs, as the major taxes have been declared off-limits, to ensure that those who can afford to pay more, contribute more. After the ructions of the Conservative time in office, markets seem more constructive about the challenge facing Chancellor Reeves and her attempts to prove fiscal sustainability. The pound is back to 1.31-1.32 versus the dollar, a level which it has not reached since 2020, although it is debatable whether this is sterling strength or broader dollar weakness. However, 1.19 against the Euro is also back to a level last seen in 2022. Sticky inflation suggests that the Bank of England (BOE) may be less likely to cut rates in September than the European Central Bank (ECB) in our opinion, with Governor Andrew Bailey providing a note of caution at the Jackson Hole Symposium and perhaps looking at November for the next move in UK interest rates.
The boost that hosting the Olympics has given France further highlights the weakness of the German economy, where growth contracted in the second quarter, and inflation surprisingly dropped below 2% in August. Spanish inflation was also weaker than expected, highlighting the possibility that Eurozone inflation may be moving closer to the ECB’s 2% target rate. Although other economies have been performing relatively better, former ECB President Mario Draghi has been researching a potential plan for fiscal stimulus which, if implemented in tandem with an ECB rate cut, may boost the region’s economic prospects. August’s Flash PMI figures suggested weakening growth in both manufacturing and services and the ECB’s July meeting pointed to a re-assessment of the appropriate level of monetary policy in September. Rate cut speculation directly affects currencies, and the Euro sits at 1.1050 versus the dollar as we witness a prolonged period of dollar weakness, with markets pricing in easing speculation, providing breathing space for the wider global economy.
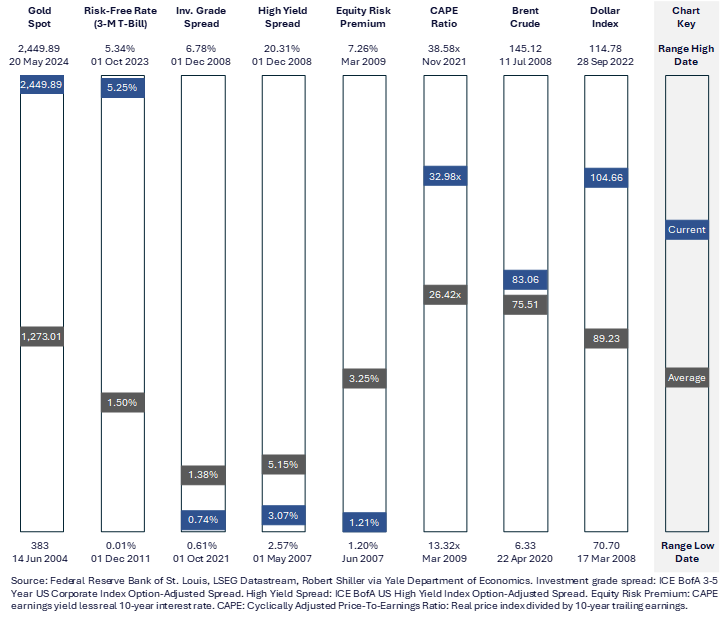
The Dollar Index has had a difficult month, losing 2.4% on shifting rate expectations and, more broadly, is down 4% this quarter-to-date, and flat year-to-date, reflecting the shift in relative real yields. Periods of dollar weakness provide a tailwind for the global economy and have pushed gold 2.77% higher in August, to $2,524/oz and burnishing the metal’s role as a hedge against geopolitical risk which is currently rising in the Middle East and Europe.
As we reach US Labour Day, we expect to see volumes start to increase, following a typically slow August as investors return from vacations. August’s volatility will encourage markets to become even more data dependent as we move towards the central bank decision-making period at the end of September. The current data sees inflation continuing to fall towards the 2% target rate, employment market pressures receding, and growth rates consistent with a soft landing. We believe this environment remains healthy for risk assets and, based on relative economic performance, continue to favour the US over other regions, as the need for monetary easing is finely balanced by continued economic resilience.
[i] Slok, Dr Torsten _ Apollo Daily Spark _ The Economy Is Doing Just Fine _ 2024.08.17
[ii] Golub, Jonathan _ UBS _ Earnings Brief 2Q24 August 29 _ 2024.08.29