by Tim Sharp
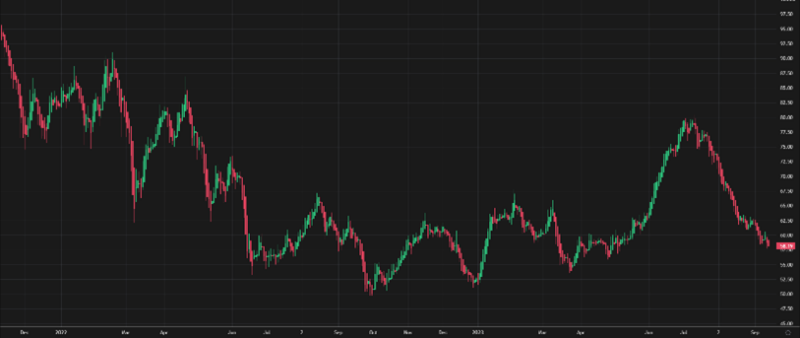
Some of the froth was blown away in April as investors became more cautious about a plausible “no landing” in the US and US interest expectations were trimmed further to less than two cuts in 2024 causing the US Treasury yield to test 5% during the month once more. Global equities fell 3.85% over the course of the month in dollar terms, with the S&P 500 down -3.97%, Eurozone -3.22%, and the Nikkei 225 -3.51%.
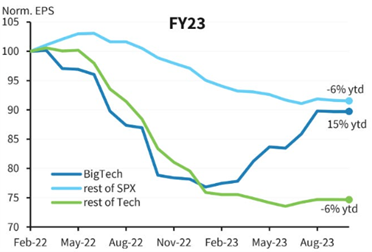
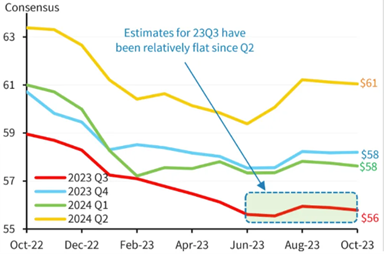
We have suggested in previous publications that after the multiple expansion of 2023 companies would need to justify equity valuations with earnings during 1st quarter 2024. As we reached the end of April approximately 55% of the S&P 500 had reported with earnings beating expectations by 8.4% versus an historical average of 4.8% and 6.9% recorded last quarter[i]. Earnings surprises are not uncommon, with guidance usually tactically reduced ahead of reporting season. However, this has been less prevalent this quarter; leading to improving outlooks and positive adjustments to Earnings-Per-Share growth.
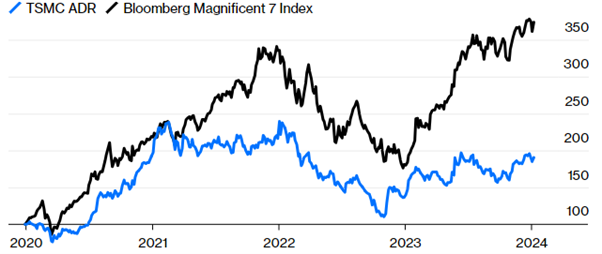
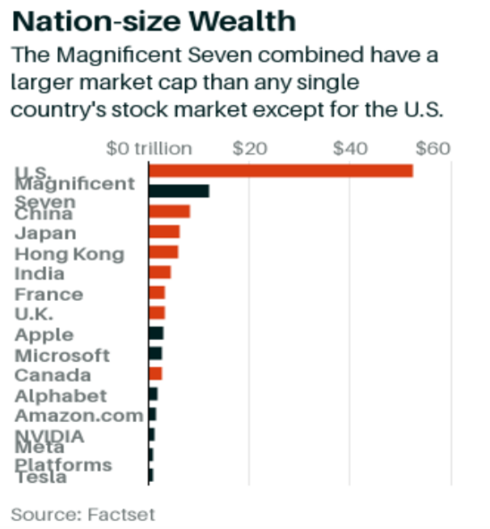
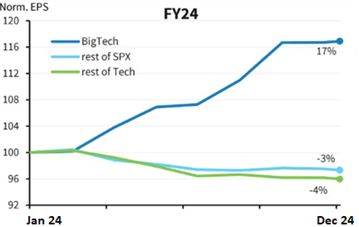
Our base case this year centred on a broadening out of returns, this began in March and continued into April. Although we think AI is an enduring theme, Meta Platforms results were accompanied by a warning from Mark Zuckerburg that to make the most of the opportunity, the company would need to spend significantly, and the benefits may take longer to reach fruition[ii]. Valuations amongst “Mega Tech” have reached stretched proportions and this might mark the point where a little realism takes hold. A broadening out of returns does not necessarily mean there has to be a downward adjustment in “Mega Tech” but perhaps a period of underperformance may release some pressure on valuations assuming earnings releases to come do not justify valuations.
The broadening out of returns has seen better performance for emerging markets and the UK. A value-based bias, along with a high proportion of overseas earnings has helped UK equities to an outlying position of +2.43% on the month. Rather surprisingly UK equities are now outperforming the NASDAQ Composite year-to-date in price terms 4.99% versus 4.31% as the valuation gap between the major indices narrows favouring markets in deep value territory such as the UK.
Central Banks remains a key focus for markets. It is widely expected that Federal Open Market Committee May meeting will leave rates unchanged. However, signalling around the future trajectory of rates will be closely followed as markets re-calibrate rate cut expectations. The outlook for rates was dealt a blow by the US Employment Cost Index Report for Q1 on the last day of the month which rose 1.2% versus 0.90% in Q423. Private industry saw compensation rise 1.1% and state workers 1.3% suggesting that although job openings are stabilising, wages are still running hot in the US. The importance of a more hawkish stance from the Fed, and the increased risk of inflation rising to financial markets was reflected in equity markets which saw the S&P 500 fall 1.57% and the NASDAQ 2.04%. on the day. We note US headline and core consumer price index inflation were hotter than expected for the third consecutive month at 3.8% and 3.5% respectively despite PMI’s missing expectations to the downside.
Further proof of a global pickup in economic activity saw European, UK, and Japanese PMI’s beat expectations. European GDP has turned a corner after weakness in Germany for most of last year. 1st quarter GDP in Germany and France grew 0.8% on top of growth of 1.2% and 2.8% in Italy and Spain. The European Central Bank (ECB) has been guiding towards a first rate cut in June, and we believe the case for rate cuts in Europe and the UK is stronger than it is in the US although such a move is often constrained by foreign exchange considerations. The Dollar Index continued to build on a stronger 1st quarter to gain another 1.6% against a basket of its largest trading partners in April, a situation that will certainly be considered at the May meetings of the ECB and Bank of England.
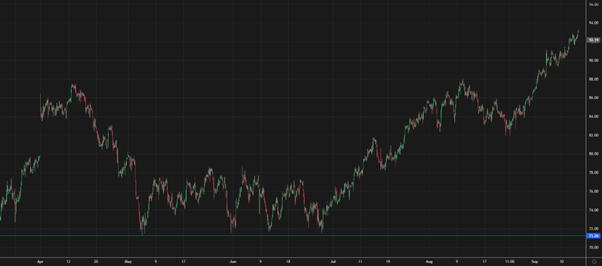
Additionally, The Bank of Japan’s decision to leave rates on hold at 0.00% in April coincided with the Japanese Golden Week holiday and in less liquid markets the Yen fell to ¥160 versus the dollar. This is likely a function of pressure created by the interest rate differential to the US. The weakness was short lived, with the currency rapidly strengthening back to ¥154.50 in an unconfirmed sign that the Japanese authorities had intervened. Intervening when volumes are low is a tactic that has been used in the past to maximum effect with signs that $20bn – $35bn of dollar reserves had been utilized, as reported by the Financial Times, although the Ministry of Finance declined to comment. This would suggest that the Japanese authorities may have decided to draw a line at ¥160 versus the dollar but it remains to be seen if they defend this level, if necessary, in the future. Although a weaker currency is good for tourism and overseas profits, it clearly affects the cost of living, and domestic consumption when the BoJ is attempting to reflate the economy and boost economic activity.
In summary, developed equity markets have paused, reacting to quarterly earnings as they are reported, while inflation pressures build, and interest rate cuts are paired back by markets with the inevitable move higher in bond yields. There is little doubt that global economic activity has rebounded, and the US economy is still running hot, which should be supportive of risk assets. Against this backdrop the disinflationary path seems less certain and investors are adjusting expectations accordingly.
[i] Golub_Jonathan _ UBS _ US Equity Strategy _ Earnings Season: Half Time Report _ April 29, 2024
[ii] Murphy_Hannah_Financial Times_April 25, 2024 [Online]
Mark Zuckerberg defends Meta’s AI spending spree as shares tumble (ft.com)