loader image

Chart of the Week: U.S Recessionary Indicators Flare as US job openings fall, Oil Rallies as OPEC+ Cuts Output

Author: Tim Sharp

Researcher: Jack Williams

Published: April 6, 2023

This week in the stock market has sent several mixed messages further fuelling asset class rotation by investors once again amidst this volatile market environment.

This week, US private sector job data surprised to the downside, indicating the possibility of a potential slowdown within the U.S economy. Private sector payrolls came in at 145,000, more than 20% below the Dow estimates of 210,000 and more than 115,000 payrolls less than the prior month of February’s upwardly revised reading of 261,000.

This data takes the average of monthly payrolls down to 1745,000 jobs/month, compared to 216,000 in the 4th quarter and more than half of Q122’s average of 397,000 jobs/month.

March’s payroll data is one of several currently flashing signals, indicating the growing potential of a slowdown in the US economy. Other signals such as warn notices (which typically tend to lead unemployment claims by 4-6 weeks) have seen a sharp uptick in recent weeks indicating the possibility of a passthrough to unemployment claims.

Combining recent unemployment data with PMI (Purchasing Manger Index) readings, which consider new orders, output, employment, delivery times and inventory levels within the manufacturing sector paints a less than enthusiastic picture with PMI’s remaining below the crucial level of 50 which is seen as a ‘breakeven’ level, where manufacturing is stable, readings over 50 indicate expansion, whilst under 50 equals contraction.

In contrary to the U. S’s growing recessionary prospects, oil has risen once again this week, buoyed by voluntary output cuts from OPEC+ members this week. With oil’s price being driven by supply and demand, supply of available oil vs the demand for the usage of that oil. When economies tip into recessionary territory, this normally leads to a sell off in the oil price as investors assume there would be lesser trips, deliveries, travel, and manufacturing needs for oil with an economy in a recession compared to a boom period where manufacturing, travel, and similar oil heavy sectors would be looking expand their activities.

Looking to get ahead of this potential price slump and stabilise the price of the commodity, OPEC+ members have voluntarily chosen to cut production outputs this week by a further 1.15m barrels-per-day (BPD), with Saudi Arabia leading the charge with a cut of half a million barrels daily starting from May. Iraq will follow suit, reducing output by around 211,000 bpd, while UAE will cut -128,000 bpd, Oman -40,000 bpd, Algeria -48,000bpd, Kazakhstan -78,000 bpd. These cuts feature alongside Russia’s 500k bpd cut previously announced in February.

Many investors will wonder though if the voluntary cut from OPEC+ member could be in retaliation to Biden and the States’ stance on oil pricing, arguing the world needs to lower prices to support economic growth and prevent Putin from earning revenue to fund his war on Ukraine.

Interestingly this has reignited the debate on oil pricing along the same timeline as the US Recession debate comes to the forefront once again, with the two ever seemingly linked.

Will the U.S tip into a fully fledged recession, achieve a soft landing or dip their toe into recessionary territory before stabilising once again, or should investors be looking at commodities like oil where supply restrictions can at least for the time being, bolster pricing power for suppliers/producers. This all becomes much more complicated to predict considering the historically rapid pace of rate rises employed by the Fed and how much lag there is from interest hikes to the knock-on effects taking place in the economy.

Sources:

Charts: RefinitvData, Variant Perception Research, RefinitivData

https://www.theguardian.com/business/2023/apr/02/opec-announces-surprise-cuts-in-oil-production-of-about-115-mbpd

https://www.investing.com/economic-calendar/manufacturing-pmi-829

https://tradingeconomics.com/united-states/manufacturing-pmi

https://www.cnbc.com/2023/04/05/adp-march-2023.html

https://www.cnbc.com/2023/04/04/jolts-february-2023-.html

https://www.cnbc.com/2023/04/04/jolts-february-2023-.html
https://www.barrons.com/articles/companies-capex-stocks-32aad443?mod=hp_LEAD_1

March Investment Review: Increased Volatility

by Haith Nori


March has seen a continuation of heightened volatility across global markets. Central banks across the developed world are considering more aggressive tactics for increasing interest rates as they are not yet achieving the desired result of reducing inflation quickly enough. Some find themselves re-assessing their originally estimated limits. The collapse of Silicon Valley Bank has created great uncertainty and fear within global markets as no one will want the history of the 2008 financial crisis to repeat itself. Governments acted quickly to prevent a financial crash. The Swiss National Bank stepped in to bail out Credit Suisse with a lifeline of $54 billion. Furthermore, UBS went on to merge with Credit Suisse.

At the beginning of March, at the Congressional Testimony, a hearing of the US Senate Banking Committee and House of Financial Services Committee, Jerome Powell suggested the possibility that interest rate hikes still have a long way to go, signalling that further, larger rate hikes may be needed. Markets reacted negatively to the announcement, sending equity markets lower. After an initial increase in bond yields, over the course of March these fell significantly.

On Friday 10th March, Silicon Valley Bank (SVB), the 16th largest bank in the US, collapsed, delivering the largest commercial bank failure since the 2008 financial crash. The bank was based in the Santa Clara region and at the end of 2022 had around $209 billion in assets. The main contribution to the collapse appears to have been a failure of management to properly manage the numerous risks that arise on bank balance sheets during periods of rapidly rising interest rates. The issue was further compounded by SVB’s concentrated exposure to the start-up and venture capital space, an area which has recent faced its own challenges which drove many of these companies to draw down on their deposit balances. The bank was heavily invested in long-dated Treasury Bonds whose value, as the Federal Reserve raised rates, markedly decreased. Silicon Valley Bank’s failure is the largest since Washington Mutual went bust in 2008, a hallmark that triggered a financial crisis that hobbled the economy for years’[i] leaving an uncertain atmosphere for many investors. Global markets in both equity and fixed income have reacted negatively to the news with Joe Biden promising to seek stronger regulations for banks in an attempt to reassure the public on the state of the economy. Nearing the end of the month, on 27th March, First Citizens bank ‘bought about $72bn of the assets of the failed bank at a discount of $16.5bn’[ii] leaving c.$90bn of securities and other assets with the Federal Deposit Insurance Corporation (FDIC). First Citizens are taking over the running of 17 Silicon Valley Bank branches and also acquiring all $119bn in deposits and loans, which were set up post the collapse of Silicon Valley Bank. Finally, the FDIC have stated the collapse may well lead to $20bn of losses for its deposit insurance fund, which is paid for by banks themselves through sector-wide levies.

On 14th March, US CPI data was released for the 12 months ending in February of 6.0%, down from January 6.4%, December of 6.5%, 7.3% in November, continuing its gradual decline since June (9.1%)! This is a more promising decrease since January showing progression has picked up again. On 22nd March, the US Federal Reserve made the decision to raise interest rates by 0.25% to a range of 4.75% to 5%, taking interest rates to their highest level since 2007 and marking the ninth consecutive month of interest rate hikes in the US. This is despite the situation of the Silicon Bank Valley collapse where analysts predicted a potential halt in altering interest rates. In the UK CPI data released was 10.4% for the 12 months ending in February, a slight increase from 10.1% in January. This is slightly disappointing as the figures had been showing a decline each month for the past several months: 11.1% in October, 10.7% in November and 10.5% in December. On 23rd March, in the UK the Bank of England announced another 0.25% increase in interest rates to 4.25% from 4%. Also, on 16th March the European Central Bank (ECB) announced a 0.5% increase in their interest rates to 3.0% as they had originally signalled.

On Wednesday 15th April, Jeremy Hunt the UK Chancellor announced the 2023 UK Budget making various changes. Notably, the UK Pension allowance has increased from £40,000 to £60,000 per annum effective from April 2023. Energy price support will continue at the current rate for the next three months to June 2023, limiting typical household bills to £2,500 per annum and corporation tax will increase from 19% to 25% from April.

On 16th April, the Swiss National Bank swooped in to provide a $54 billion bailout to Credit Suisse in order to ‘shore up liquidity and investor confidence, after a slump in its shares had intensified fears about a global banking crisis’[iii]. A few days later UBS came to Credit Suisse’s further aid as the bailout from the Swiss National Bank was not enough, and ‘UBS will pay $3.2 billion for 167-year old Credit Suisse and assume at least $5.4 billion in losses from unwinding its portfolio of derivatives and other risky assets’[iv]. This leaves the Swiss Nation with only one universal bank; UBS Group AG.

In other assets, there has also been increased volatility. During March Gold reached its highest level for several months, Brent Crude dropped sharply at the beginning of the month to c.$73 and has since recovered slightly to end the month c.$79.77. The Dollar, after initially showing signs of strength, has decreased in value against the UK Pound, the Euro and the Yen. Both US 10 year Treasury notes and UK 10 year Gilts followed the same pattern of starting the month at strong levels reducing in yield to then slightly recover at the end of the month but still c.0.5%/0.4% lower in yield.

Overall, March continued the volatility witnessed in February across asset classes. The news of the Silicon Valley Bank collapse shocked global markets yet most Central Banks continued with planned interest rate hikes. Both Silicon Valley Bank and Credit Suisse have been bailed out. Brent Crude dropped sharply below $75 per barrel having started the month at c. $84 per barrel but recovered some of its losses by the end of March. Since the start of March, 10 year bond yields have generally fallen.


[i] https://www.reuters.com/business/finance/global-markets-banks-wrapup-1-2023-03-10/

[ii] https://www.theguardian.com/business/2023/mar/27/silicon-valley-bank-bought-by-first-citizens

[iii] https://www.reuters.com/business/finance/credit-suisse-borrow-up-54-bln-it-seeks-calm-investor-fears-2023-03-16/

[iv] https://www.reuters.com/business/finance/ubs-swallows-doomed-credit-suisse-casting-shadow-over-switzerland-2023-03-20/

Chart of the Week: Credit Suisse AT1 Bonds Decimated Following a Tough Week for Banking Stocks

Author: Tim Sharp

Researcher: Jack Williams

Published: March 22, 2023


Amidst the chaos in the banking sector this week, comes the destruction of Credit Suisse’s AT1 bonds, sending ripples through fixed income markets and causing hefty losses for bond giants such as Pimco who saw losses of $340 million on the banks AT1 product.

The deal between UBS and Credit Suisse leaves CoCo holders to bearing the losses while shareholders receive a small token with one share of UBS being exchanged for every 22.48 shares of Credit Suisse held.

Shown above is the WisdomTree AT1 CoCo bond UCITS ETF, which combines various AT1 products from across the banking universe to form a diversified ETF. Since the turn of the month, the funds value has fallen by nearly 12% and by more than 7.5% in the past 6 days alone showing the serious concerns of investors holding CoCo bonds, and investors uncertainty surrounding European banks in general. The fund now trades a mere 20 cents from the low it marked back in March 2020 when Coronavirus made its debut appearance.

AT1 bonds, otherwise known as CoCos (Contingent Convertible Bonds), have unique features dissimilar to other bonds investors may hold, they are issued by banks to raise capital. AT1 bonds are unique in the way they are designed to absorb losses in the event the issuing bank experiences financial distress. These bonds once again dissimilar to other bonds can be converted into equity or written off completely if certain conditions are met, such as falling CET1 ratios.

While CoCo’s tend to pay an exacerbated yields in comparison to other banking bonds, this is justified by being amongst the first few rungs of debt to be potentially restructured or written off when a bank comes into trouble such as we have seen with Credit Suisse in recent days.

While UBS has stepped in and made a deal for Credit Suisse, investors remain concerned about the wider banking market as seen by the huge declines in banking stocks across the EU, U.K and U.S. over the past week. Furthermore investors are now posing questions as to banks profitability after long swathes of time in low interest rate environments where deposits may have been hedged using fixed income securities now trading well below their waterline due to the rapid pace of interest rate increases employed by central banks around the world.

A mere month ago, financials was one of the most overcrowded, overweight sectors positioning wise. Now investors are reassessing the sector once again, having seen shares slide to the downside, this poses the question are the banks an opportunity at these levels, or something to avoid.


https://www.reuters.com/markets/rates-bonds/pimco-lost-340-mln-with-credit-suisse-at1-bonds-write-off-source-2023-03-21/

https://www.pimco.co.uk/en-gb/investments/gis/capital-securities-fund/inst-gbp-hedged-inc

https://www.theguardian.com/business/2023/mar/18/bank-runs-bailouts-rescues-are-the-ghosts-of-2008-rising-again

https://www.ft.com/content/fcfaea32-7288-49f8-acb0-84c846b157d9

https://www.theguardian.com/business/2023/mar/20/at1-bank-bonds-credit-suisse-bondholders-cocos

Charts:

1st: Wisdomtree AT1 CoCo Bond Fund – LP68490358 1Yr Chart

2nd : PIMCO GIS Capital Securities Inst GBP Hgd Inc – LP68227330

3rd : Wisdomtree AT1 CoCo Bond Fund – LP68490358 3.5Yr Chart

Chart of the Week: U.S. Job Data Shows First Cracks of Weakness – Could This Be the Turning of the Tides?

Author: Tim Sharp

Researcher: Jack Williams

Published: March 12, 2023

Recent emergence of bearish data on the US economy, alongside the failing of two prominent financial institutions in the states such as Silicon Valley Bank, has prompted investors to reassess both the outlook for the US recession in the coming months, and the Fed’s ability to raise interest rates further.

Construction job openings in the US dropped heavily in January, plunging by more than 240,000, representing a near 50% fall from the prior month’s construction job postings figure.

Construction in the USA is a massive contributor to GDP and while it’s contribution as a percentage of GDP has been gradually falling in recent years, the sector still makes up around 3.90% of the overall GDP figure.

The near 50% fall witnessed in January was the largest ever monthly decline in construction job openings data history which has been running for nearly 20 years. On a wider lens, overall job openings dipped only slightly in January suggesting the wider economic picture is still at somewhat of a strength.

Figure 1 – US 2021 GDP By Sector

This matters as fed members in recent months have renewed their hawkishness and are looking to push ahead with further rate hikes, both of the recent banking collapses and the recent release of construction jobs data, which throws a spanner in the works, further complicating the issue.

Many investors believe the economic impact from the 4.5% worth of interest hikes the Fed has already delivered over the past 12 months have not been felt fully by investors. Economist Milton Friedman wrote in length regarding his view on the lag that monetary policy works with; Friedman claims it can take years for Fed interest rate changes to make their way through to the economy. Although useful to note, most of his monetary policy work was published in the late 60’s and the makeup of economies now are very different from what they were in the period his work was published, the interest rate was still relatively high around the time of his publications 4.6-5.7%.

This theory has already started being priced into markets with fed swaps pricing no additional rate hikes as the most likely scenario, and around an 80% probability being priced for no rate hike on the March 22nd meeting. Vastly different from the probabilities the market was pricing even this time last week.


https://www.statista.com/statistics/248004/percentage-added-to-the-us-gdp-by-industry/

https://www.jstor.org/stable/1828534

https://live.barcap.com/PRC/publication/FC_TEJ-IH4gfiB-IH4g_640f47431055c101cec9f9ee

https://www.axios.com/2023/03/09/construction-softness-underscores-feds-tough-call

https://www.marketwatch.com/story/bank-debt-swoons-as-fed-moves-to-contain-fallout-from-sbv-signature-bank-collapses-9588e016

https://www.ft.com/content/7e7fdddb-724c-42fd-98ee-5d7248d53334

https://www.ft.com/content/b860ebb6-f202-4ec6-a80c-8b1527c949f4


Chart of the Week: Investors Appetite for Risk On Growth Stocks Has Paid Off So Far in 2023

Author: Tim Sharp

Researcher: Jack Williams

Published: March 8, 2023

XRT – SPDR Retail Sector               XLE – SPDR Energy Sector               

                          XLV – SPDR Healthcare Sector        XLK – SPDR Technology Sector

February surprised investors as the uncertain macro backdrop and market volatility gave way for risk on assets to outperform once again, defying many market commentators and veteran investors’ theories that the recent rise in equity prices were down to little more than a bear market rally.

The graph above shows relative performance from the start of 2023 across sectors replicated via ETF’s. While XRT, the S&P’s retail sector focused ETF, gained traction early in the year, gains were parsed and overtaken by XRK, the S&P’s Technology sector focused ETF, which now sits at a YTD return of around 15% compared to Retail stocks, who have seen their 25% gain seen towards the end of January deteriorate to current levels representing roughly a 10% return on a year-to-date basis.

.STOXXE – Europe                        .SP500 – USA                               .N225 – Japan                         

.HSI – China                                  EWU – United Kingdom


On a global front, the markets which saw huge inflows at the beginning of the year, such as China’s Hang Seng Index which was buoyed by the news of zero covid policies ending in the region, have now parred their gains compared to their global peers. Looking at year to date returns, European equities have outperformed peers with the EuroStoxx50 Index sitting at a near 10% year to date return.

China’s Hang Seng Index is the second-best performer, holding onto 5% returns as of this point in the year, although down dramatically from the over 15% return investors would have seen from the index from the start of the year to the end of January.

The MSCI U.K index saw healthy returns of nearly 3% in the month of February buoyed from rising flash PMI’s and weaker than expected inflation data. The UK’s main blue-chip index hit a fresh all time high in February reaching over 8000 points to many investors’ delights.

Investors are now wondering where performance will stem from moving forward through 2023, which is no doubt harder to ascertain given the numerous conflicting data points the market has been given in such a short period of time.

With inflation still running at elevated levels and government bonds yielding around 4% on the high end, investors still have an appetite for inflation beating returns which seems to explain growth sectors being the ones which have rallied the hardest since the start of the year. In what has been for many months now a risk off environment, it has been growth stocks as of recently that have outperformed, both on the upside in January and in February on the downside.

Whether this trend will continue remains to be seen, but investors are watching numerous data points in an attempt to pre-empt where the flow of capital will be directed towards next. Corporate earnings are being followed diligently, with analysts having cut their targets by as much as 3.4% in the first two months of the year, while companies so far have surprised to the upside with their earnings (on average +1.6%). Demonstrating that the true effects of central bank policies and slowing economies are yet to be felt. Corporate’s ability to weather these headwinds will dictate the strength and direction of their share price, until a clearer macroeconomic picture develops, giving investors renewed confidence.


Sources:

Data/Charts – Hottinger/Refinitv Data

MSCI – https://www.msci.com/documents/10199/3b75b636-55c0-4ce8-a8aa-6bb70e12b99d#:~:text=The%20MSCI%20United%20Kingdom%20Index,market%20capitalization%20in%20the%20UK.&text=The%20MSCI%20United%20Kingdom%20Index%20was%20launched%20on%20Mar%2031%2C%201986.

https://markets.businessinsider.com/news/stocks/stock-market-earnings-expectations-profit-analysts-interest-rates-fed-sp500-2023-3

February Investment Review: Volatility in the Air

by Haith Nori

February saw a continuation of increases in equity markets in Europe after a positive start in January, while US markets have moved in the opposite direction. At the beginning of February many central banks including the Federal Reserve, the Bank of England and the European Central Bank all increased interest rates once more. After an initial drop in yields, US and UK 10 year bond yields at the beginning of February have recovered to levels higher than seen in January as many other 10 year bond yields have reached highs not seen in years. The US Dollar has once again strengthened as the price of gold has fallen. Global tensions continue to rise as Russia’s invasion of Ukraine reached its one year anniversary (24th February). Rishi Sunak is also attempting to push forward Brexit negotiations, having delivered the ‘Windsor Framework for Northern Ireland and Great Britain’.

On 1st February, the US Federal Reserve made the decision to raise interest rates by 0.25% to 4.75%, marking a notable reduction in pace from their previous increase of 0.5%. Markets responded positively to the news, with the Technology sector in particular outperforming others, however February saw a more general decline alongside US Equity indices. On 14th February we received a Valentine’s gift. US CPI data was released for the 12 months ending in January of 6.4%, down from December of 6.5% and 7.3% in November, continuing its gradual decline since June (9.1%)! Whilst this is still a decrease it is much lower than expectations and suggests a long-awaited slowing in the rate of progression. On Thursday 2nd February, in the UK the Bank of England announced an 0.5% increase in interest rates to 4%. As expected, they did not follow the US in targeting a reduced pace of 0.25%. Furthermore, in the UK CPI data released was 10.1% for the 12 months ending in January down from 10.5% in December, 10.7% in November and 11.1% in October. On this occasion, this was softer than consensus expectations and the reduction pattern is continuing in the UK. Also, on 2nd February the European Central Bank (ECB) announced a 0.5% increase in their interest rates to 2.5%, and the ECB have ‘pre-announced another increase of the same size for March 16’[i]. The ECB continues to  present itself as being particularly hawkish under the stewardship of Madame Lagarde.

In Bond Markets, ‘Germany’s 10-year yield, the benchmark for the euro area, rose 7 basis points (bps) to 2.66%, its highest since July 2011’[ii] and the same has been seen in both France and Spain where yields have hit their highest levels in many years. Both the UK 10 Year Gilt and US 10 Year Treasury Note yields have surpassed their January levels, both increasing to just under 4% after an initial drop at the beginning of February. The US Dollar has regained its losses from January against Sterling, the Euro and the Japanese Yen. Gold, after reaching a high level at the beginning of February has returned to levels at the start of January. Prices for gold at the end of February ‘were headed for their biggest monthly decline since June 2021 as a stronger dollar and fears that the U.S. Federal Reserve would keep raising interest rates weighed on the non-yielding asset’s appeal’[iii]. We are seeing a very uncorrelated performance from assets including what was once considered the safe havens.

On 11th February, Fumio Kishida, Prime Minister of Japan, nominated Kazua Uedo as the next Governor of the Bank of Japan, who is set to take the reins after 8th April when Haruhiko Kuroda steps down. This has come as a surprise as originally the Deputy Governor Masayoshi Amamiya was viewed as being the front runner.

After several countries, including the UK, the US and Germany agreed to send military battle tanks to aid Ukraine in January, President Volodymyr Zelenskyy of Ukraine has been touring Europe in an attempt to drum up more military support. Firstly, he flew to the UK to meet with Prime Minister Rishi Sunak whom, after their meeting, is providing NATO-style training to thousands of Ukrainian soldiers and marines from the UK. Rishi Sunak is also considering his options to offer fighter jet planes. Zelenskyy then flew to Paris meeting with Emmanuel Macron and Olaf Scholz before flying to Brussels where he addressed the European Parliament, meeting with twenty-seven heads of state asking for European Unity. In the run up to the one-year anniversary of Russia’s invasion of Ukraine (24th February), US President Joe Biden travelled to Kyiv on Monday 20th February and later met with NATO leaders on the eastern flank to highlight geopolitical tensions. We are seeing clear escalations in the Russia invasion of Ukraine.

On 27th February a new Brexit deal was signed by the UK and European Union known as the Windsor Framework, which attempts to deal with the problems created by the Northern Ireland Protocol, binding international law obligations. One of the key issues has been checks on goods travelling from Great Britain had created a border with Northern Ireland and hence certain goods were no longer able to reach them. The Windsor Framework will, as Rishi Sunak has said, ‘ease trade between Britain and Northern Ireland, firmly root the province’s place in the United Kingdom and give lawmakers there a say in whether they must implement EU law, with London having a veto’. [iv] There is a long way to go and this needs to be approved by all parties but is a positive step forward for Brexit and will hopefully open up more lines of trade.

Overall, February has been reasonably volatile across various asset classes, with Large-Cap UK Equities in particular having hit an all-time high. Brent Crude fell sharply in value at the beginning of the month (below $80 per barrel) but has since recovered to c.$84 a barrel. 10 year bonds are increasing in yield, with various countries now having reached all-time highs. The US Dollar has gained strength back from its lows of January against Sterling, the Euro and the Japanese Yen. Geopolitical tensions are rising with Russia’s invasion of Ukraine.

[i] https://www.reuters.com/markets/rates-bonds/hawkish-ecb-comments-push-up-rate-hike-expectations-2023-02-17/

[ii] https://www.reuters.com/markets/global-markets-wrapup-1-2023-02-28/

[iii] https://www.cnbc.com/2023/02/28/gold-faces-worst-month-in-nearly-two-years-on-us-rate-hike-dread.html
[iv] https://www.reuters.com/world/uk/risk-taken-uks-sunak-announces-windsor-framework-2023-02-27/

We Ask Questions of Buy and Hold Strategies

Many investors over the past 12-24 months, with the benefit of hindsight, may have found themselves wishing they had crystallised some gains before the market correction affected high flying, more interest rate sensitive sectors such as technology. It has also renewed the debate as to whether an actively managed investment portfolio can be physically maintained alongside legacy buy and hold strategies.

Most investors enjoy watching the stocks they own, develop, and grow in value over time, but at what point does that growth become a hindrance to the diversification, safety and opportunities within the rest of your portfolio?

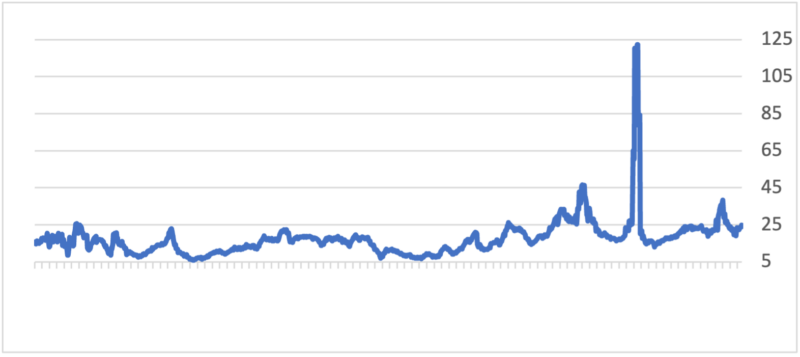
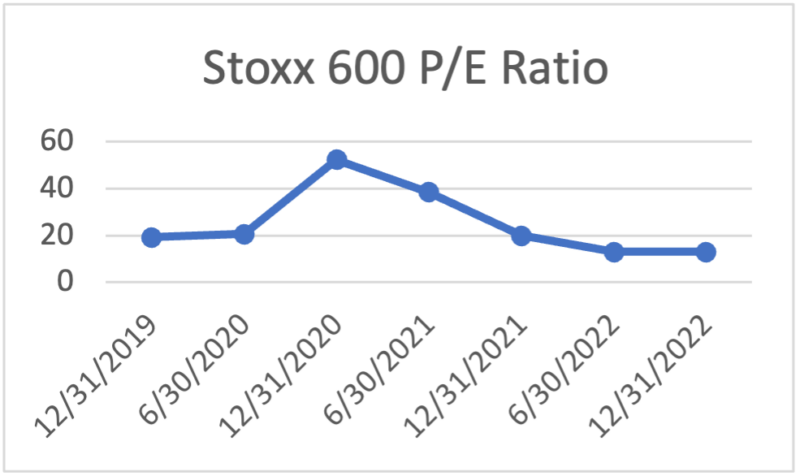
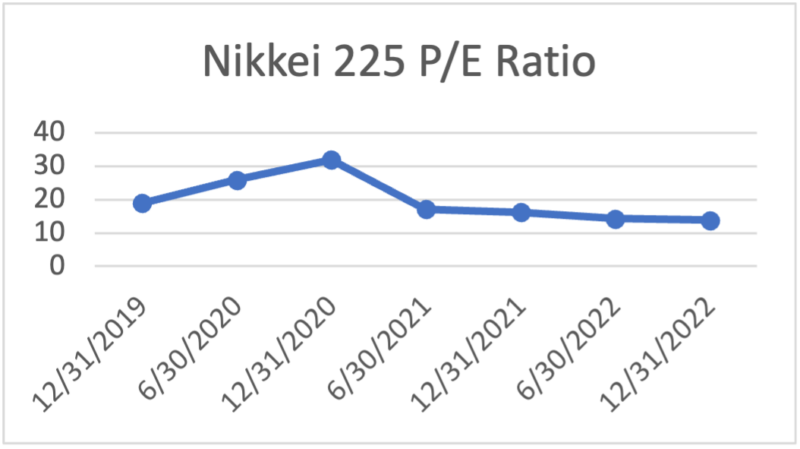
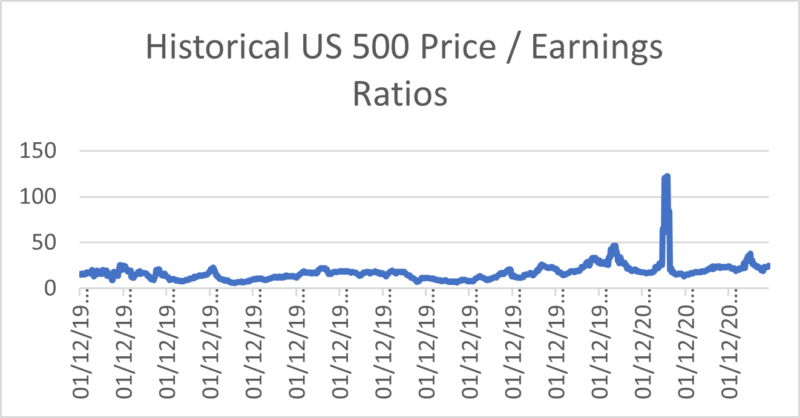
Buy-on-dips or buy-and-hold strategies have been a key strategy since the Global Financial Crisis (GFC) particular as the volume of passive investment strategies has grown, and Quantitative Easing (QE) turned asset markets into a one-way bet, however, the point of entry matters over time. Absolute Strategy Research (ASR), the Independent Macro-Strategy Research Provider to Hottinger, point out that strong equity returns in the medium to long term tend to rely on a sound starting valuation. We believe it will be very challenging to attempt to trigger a new bull market equity rally with stock market indices priced at around 20 times price-to-earnings valuations, and it can often take a long time to recover from a significant drawdown following peak valuations: examples would be 29 years after the 1929 crash and 15 years following the 2000 tech market bubble. We would argue that the rally seen in cyclical stocks since the start of the year smacks of investors looking to re-invest after the 2022 drawdown, especially in technology stocks, without giving due consideration to the entry point. Indeed, ASR point out that the correlation between cyclical stocks and the ISM New Orders Index has broken down as the New Year rally pushes ahead of fundamental economic data.

A buy-and-hold strategy since the GFC will have amassed some significant gains in some now mega-cap companies, and the maintenance of such a portfolio requires the trimming of positions in order to maintain the integrity and diversification of the portfolio as a whole. Running a portfolio with many out-sized positions could lead to unintended consequences on the upside through sector rotation and the downside when certain sectors re-value as with technology in 2022. As a discretionary investment manager, we would consider investment decisions to be the main consideration when constructing and maintaining an investment portfolio and any decisions surrounding taxation to be secondary. We believe allowing taxation to dominate investment decisions will lead to questionable decision-making and a less efficient deployment of capital.

In the UK, many investors have made good use of the capital gains tax annual allowance to trim positions thereby reducing the tax liability created through the crystallisation of gains. Afterall the decision to pay capital gains tax (CGT) could be considered voluntary because the decision to crystallise a gain is voluntary. However, we would argue that having made the decision to create an investment portfolio, and perhaps seek professional advice,  the investor has decided that they wish to employ a strategy that promotes investment decision-making. The 2022/23 CGT individual allowance is £12,500 and the government has announced plans to halve the capital gains tax to £6,000 this year, and again to £3,000 in 2024. This will increase the difficulty of using the allowance to maintain an efficient, balanced portfolio meaning many investors may find themselves with larger CGT liabilities going forward.

While we do not provide tax advice and do not run investment management strategies based primarily on tax efficiency, there are certain options investors may wish to consider in coming months as the deadline for CGT allowance cuts approaches and we would advocate seeking professional advice where appropriate. We also appreciate that current UK government policy is open to any policy change or amendment proposed by any future administration.

Currently, a lifetime buy-and-hold strategy will see all unrealised gains nullified on death by the prospect of pending inheritance tax considerations, however, such a strategy for those with the prospect of many years of investing ahead of them could suffer from many of the disadvantages already discussed. A CGT allowance is a ‘use it or lose it’ type of tax system, meaning unused allowances cannot be carried into the next year. Considering the allowance halving this year, then halving again the next, it could well be worth thinking about making the most of the current £12,300 individual allowance if not already done so.

Historically, many investors tend to opt for living off the income derived from capital thereby paying income tax on dividends at their personal rate rather than paying CGT. However, it may be useful to note that CGT rates are dependable on an investors income band, and it can, in some cases, be more tax efficient to take a CGT gain rather than potentially raising their income tax band, which also has a knock-on effect to CGT rate. If a spouse has a different tax band an investor may wish to seek advice about transferring assets without creating a tax event.

There are a number of tax wrappers that allow an investor to build an investment strategy without tax considerations namely ISA’s, investment bonds, and Self Invested Pension Plans (SIPPS). Indeed SIPPs also have the benefit of all contributions being gross of income tax. Furthermore, the use of open-ended investment funds also allows the fund manager to manage the portfolio and the tax considerations within while the end investor only deals with such considerations at disposal.

Alternatively, if an investor does not wish to manage out-sized gains within a portfolio, there may be an option available to ring-fence such positions more efficiently in an execution-only account and allow their managed investment strategy to continue without the incumbent distractions. However, this does not stop such investments from impacting on the overall estate of the investor so absolute confidence in the decision to make lifetime hold decisions for tax reasons should be taken with due consideration under professional advice.

In a world where economic and investment cycles seem to be shortening giving rise to short term periods of extreme volatility it may pay to be nimble, agile, and responsive to both threats and opportunities in these challenging times by focusing on key investment management decision-making. As the CGT allowance falls to £3,000 from April 2024 onwards celebrating profits on good investments net of tax considerations and maintaining a suitable investment strategy that allows for appropriate decision-making could be key to maximising future returns.

Chart of the Week: Natural Gas Prices Deflate As Equity Markets Rise

Author: Tim Sharp

Researcher: Jack Williams

Published: February 8, 2023

A warmer end to the year in Europe, better than expected Q4 earnings and a weaker dollar have formed the perfect storm, fuelling a strong start of the year for equity markets considering the challenging macro-economic environment in the background.

European bears have had their eye on the Natural Gas price for months now, with a colder than average winter forecasted earlier in 2022, European investors are now breathing a sigh of relief as natural gas prices, catalysed by the ongoing war between Ukraine and Russia, plummet from their highs.

ICE’s natural gas futures ($NGLNQC) marked it’s 2020 low around June at a price of $10,  the following 18 months saw contract prices appreiate to a high of around $780, a move of over 750% for investors early to the trade.

With EU power supply heavily dependant on Natural Gas, this tends to feed into energy prices and in turn inflation, causing concern amongst Investors and Governments alike. With Nat Gas having fell so dramatically from it’s highs and the back end of winter in sight, many investors once with eyes fixed on commodities are now starying to look at main markets once again for oppertunities.

January has been a welcomed start to the year, bringing a 7% advancement in global equities companred with the 4% sell off seen in december. The UK’s Blue Chip 100 Index has advanced nearly 4% at time of writing, alongside breaching it’s all time high of 7877, trading through the 7900 level while the STOXX600 Index has appreciated 6.66% YTD.

In the US, Markets bounced heavily, favouring Tech, Industrials and Banking sectors, the US’s Nasdaq100 index advanced 15.2%, US500 gained 7.27% while the Dow, still in positive territory, lagged behind producing 1.94% worth of gains.


(Data/Sources: Charts – RefinitivData, Bloomberg, J.P. Morgan, Barrons Inc. 2023)


January Investment Review: New Year Bounce Back

by Haith Nori

January has seen an increase in global equity markets after a slightly volatile December. Central Banks are hosting their next interest rate meetings at the beginning of February, giving January a little rest. China has continued to open up after intense lockdowns with a release of 3% GDP growth in 2022, the second slowest rate of economic growth since the 1970s. Many emerging market economies are also coming back into the limelight offering lowly valued equity markets and attractive sovereign bond yields.

On 12th January, promising data presented itself for US inflation which, for the 12 months ending in December, came in at 6.5%, down from 7.3% in November and continuing its gradual decline since June, marking the sharpest monthly fall in US CPI figures since mid-2020! Furthermore, in the UK CPI data released was 10.5% for the 12 months ending in December, down from 10.7% in November and 11.1% in October. Whilst progress is slower than in other parts of the world, a trend is beginning to emerge in the UK inflation data. The next meeting about interest rates will be 31st January – 1st February for the US Federal Reserve and 2nd February for both the European Central Bank and the Bank of England. Global markets are waiting with bated breath to see how Central Banks approach their next steps in controlling inflation and if we are to see a reduction in the scale and frequency of hikes. ‘UK wages grew at the fastest rate outside the pandemic period at the end of 2022’[i] up 6.4% on an annual basis, marking the largest increase since 2001. The rise in wages strengthens the case for the Bank of England’s Monetary Policy Committee to keep raising interest rates, although any further hikes should be finely balanced in the context of weaker economic growth expectations and a more challenging housing market. Whilst wage growth is good news for households in the UK, figures have still failed to keep up with inflation. Both the US 10 Year Treasury Note and the UK 10 Year Gilt have decreased in yield since the beginning of January 2023. On Wednesday 18th January, the Bank of Japan made no policy changes as expected, keeping its yield curve control targets in place (0% for 10year yield and -0.1% for short term interest rates).

Emerging market debt has come back onto investors radar screens following a difficult period in which the US dollar rose strongly. When the dollar rises, many developing countries local currencies tend to depreciate given typically high external debt positions, which are most often financed in dollars. They will see higher imported inflation with food and oil prices. Dollar strength tightens financial conditions for some emerging market countries and can affect the availability of credit. ‘The dollar has depreciated 7% since its highs in October, pushing EM assets higher’ [ii] as the two have historically have an inverse relationship. Analysts have suggested there could be room for further outperformance from emerging markets as the dollar may continue to depreciate. Many of the emerging market countries began increasing interest rates early in 2021, long before the Federal Reserve and many other Central Banks of developed countries across the world, which has resulted in many emerging market countries offering some very attractive yields. Examples, of where some 10 year Government Bonds are yielding are: Brazil c.13.19%, Mexico c.9%, Egypt c.20.1%, Zambia c.30.19% and Turkey c.10.7% to name just a few.

The CBOE (Chicago Board Options Exchange) Volatility Index (VIX), which is a real time index representing market’s expectations for volatility over the coming 30 days, has been on a steady decrease since October which coincided with the US dollar’s all-time high. Gold has also been on a steady increase in price since October. Both Sterling and the Euro have increased against the dollar steadily since the end of September 2022. China has continued to show positive signs of growth since it began to re-open after lifting its zero-covid policy. This has been especially helpful for business over the period of Chinese New Year.

The International Monetary Fund (IMF) on Tuesday 31st January raised its Global Growth outlook for 2023. This is due primarily to demand in the US and Europe, alongside China’s re-opening and a significant easing in European energy costs. The IMF has ‘said global growth would still fall to 2.9% in 2023 from 3.4% in 2022’, [iii]  however this is an improvement from the October 2022 prediction of 2.7% with the warning of the world tipping into recession. Following the 2023 prediction, the IMF has also stated that global growth would accelerate to 3.1% in 2024. Whilst progress is slow, there is at least some positivity that can be taken from their outlook, in which they revised China’s growth forecast much higher for 2023, from 3% to 5.2%.

Many countries have been answering the calls of Ukraine for additional support in the ongoing crisis with Russia. Germany made an announcement on 25th January to supply 14 military battle tanks and encouraged other European countries to do similar The US later that day also declared further aid with the supply of 31 tanks. Finland, Poland, the United Kingdom, Spain, the Netherlands and France are also considering making contributions. This is a major development in the situation.

Overall, January has welcomed back some positivity within global markets. Brent Crude dropped sharply in value at the beginning of the month but has recovered its value above the December highs, ending at just under $85 per barrel back up from the lows of December ($76.10). US and UK bond yields continue to fall and are becoming less attractive relative to some emerging market bonds, which have the potential to deliver very attractive real returns to investors.

[i] https://www.ft.com/content/b25fd8d7-f7bd-4501-8a32-21d338846f85

[ii] Look who’ emerging as the biggest star of 2023–Points of no return, John Author’s

[iii] https://www.reuters.com/markets/imf-lifts-2023-growth-forecast-china-reopening-strength-us-europe-2023-01-31/

Chart of the Week: Personal Savings Rates Crater While Bank Deposits Soar

Author: Tim Sharp

Researcher: Jack Williams

Published: January 31, 2023

The relationship between personal savings rate and checking deposits is an important aspect of finance. Personal savings rate refers to the percentage of one’s disposable income that is saved, while checking deposits refer to the money held in a checking account.

A high personal savings rate is an indicator of financial discipline and stability. It means that a person is able to control their spending and save a significant portion of their income. A high savings rate also provides a cushion for unexpected expenses and can be used as a source of funds for large purchases, such as a home or a car.

Checking deposits, on the other hand, refer to the money that a person holds in their checking account, which is accessible and can be used to pay for everyday expenses. Checking deposits provide convenience and security.

A dwindling savings rate, as seen above, shows people are finding it harder to save a portion of their disposable income, whether this is due to the prices of goods rising with inflation, changes in lifestyles since the pandemic or stagnant wages. Inversely, high checkable deposit rates, as shown above, could mean people feel generally uncertain about spending in this period of time. Again, this is further shown when looking at consumer confidence which remains near to historical lows in both the U.K, Eurozone and USA.

These three data points, checking deposits, savings rates and consumer confidence, are being watched eagerly by investors at the moment. If consumer confidence picks up, perhaps the dam of savings accrued by individuals since the pandemic, and yet to be spent, could make its way into the economy. While on the other hand, if savings rates tick up, this could mean wage growth translating through to the general population which would mean for a healthier consumer and in turn perhaps trickle down into the economy.


Data & Charts – Refinitiv Data, Bloomberg Data, Gemstock Data, Gemstock Fund, Statista Inc. 2023

Chart of the Week: Greyscale BTC Trust Dislocates from Bitcoin Price

Author: Tim Sharp

Researcher: Jack Williams

Published: January 25, 2023

Greyscale Bitcoin Trust, a widely used vehicle for investors looking to gain exposure to Bitcoin whilst remaining within the safety of a stock exchange, has been on a wild ride the past 24 months. A journey that in early 2021 saw the trust NAV exceed the price of the BTC it holds within, now trades at a steep discount to the real Bitcoin asset itself.

NAV or the Net Asset Value is the value of the underlying asset relative to the price of the trust it is held within. Discount to NAV on Greyscale has climbed as investors offloaded cryptocurrency and growth stocks in recent months as inflation and interest rates soared.

Once trading at a 26%+ premium to the Bitcoin price, Greyscale Bitcoin Trust now trades at a steep 48.23% discount to Bitcoins price of $17,000 at the current time of writing, meaning Greyscale’s Bitcoins are currently worth around $9200 on a NAV adj basis.


Chart of the Week: Vanguard U.K. 100/250 Spread at Widest since 1986

Author: Tim Sharp

Researcher: Jack Williams

Published: January 18, 2023

Through 2022, a period of global instability, uncertainty and constant investment landscape changes, the U.K.’s blue chip index shown below (Vanguard FTSE100 ETF)  has been the best performing developed index of the year. Thanks to the structure of the constituents within the index, following rises in energy prices, sterling slipping against the dollar, and even throughout the Trussenomics debacle, UK blue chip investors have seen positive returns of +3.76% (1Y) compared with the UK 250’s less impressive return of -15.47% (1Y)

U.K 100 ETF’s have enjoyed strong earnings from Oil, Gas and Mining companies along with weakness in sterling fuelling gains, while the UK’s Vanguard FTSE250 ETF with higher sensitivity to the U.K economy has shed almost a fifth of its value through 2022 and now sees the largest price disparity compared to its blue-chip counterpart since 1986. Shell and BP, both Vanguard FTSE100 ETF constituents, have reported some of their most profitable periods in their company’s history, BP recently doubled its earnings to $8Bn and Shell beat its all-time profit record set in 2008 of $31Bn.

As rates continue to rise, investors seem hesitant to onboard risk assets, seeking bulletproof earnings and expandable markets as they search for some safety in this uncertain period. While UK100 ETFs continue to climb, just 77 points from the index’s all-time highs, UK250 ETFs continue to be unloved by investors. With inflation and borrowing costs affecting the appeal of risky assets, UK250 ETFs appears somewhat inversely correlated to peak interest rate expectations. After the Government’s disastrous mini budget, rate expectations for 2023 sat near 6%, leaving UK250 ETFs in oversold territory within indicators. With government stability somewhat returning, and rate expectations having somewhat cooled from their highs, investors are questioning whether a potential peak in Gilt yields or Rate expectations could give the index some room to rise. Charted below is the Vanguard FTSE100 ETF and Vanguard FTSE250 ETF comparatively showing the huge spread between the two.

Vanguard FTSE 100 UCITS ETF (GBP)

Vanguard FTSE 250 ETF

Vanguard FTSE 100 ETF GBP (White) Vanguard FTSE250 ETF GBP (Blue)

December Investment Review: Central Banks Attempting to Restore Calm

by Haith Nori

Global equity markets in December saw a slight decline from their November highs in the run up to the holidays. Central Banks have hinted at slowing their interest rate hiking programme with the FOMC, BOE and ECB all raising interest rates by 50 basis points, lower than previous interest rate hikes of 75 basis points. This may pave the way for a potential end in sight. China has been easing lockdowns, re-opening areas around the country and lifting international travel restrictions. China’s re-opening should be better for business globally. The Bank of Japan also made a surprise announcement to change its bond yield control policy.

The US Federal Reserve made the decision to increase interest rates by 0.50% on 14th December 2022 which confirmed what the markets were expecting. This is the first 0.50% increase as the past four consecutive meetings, the US Federal Reserve have increased by 0.75%. Promising data has presented itself for US inflation for the 12 months ending in November 2022 of 7.3%, continuing its gradual decline since June. The decision to opt for a 50 basis point hike shows positive signs that inflation is reducing and confirmed that the beginning of a reduction in the pace of policy tightening has started. For the first time UK CPI data was encouraging, releasing a figure of 10.7% for the 12 months ending in November. Whilst this figure is still very high, we have seen a reduction from October’s figure of 11.1%. On 15th December 2022, The Bank of England also decided to raise interest rates by 0.50% to 3.5%, as analysts had been expecting, which, like the US, was also a reduction from the previous hike of 0.75%. On the same day the ECB made the decision to join the interest rate train by also increasing interest rates by 0.50%, pledging ‘further hikes and laid out plans to drain cash from the financial system as part of its fight against runaway inflation’[i]. Global Equity Markets reacted negatively to the interest rate news, which was all released in two consecutive days. The UK 10 year Gilt yield, the US 10 year Treasury Note yield and the 10 Year Bond yield all increased after the news was released and ended the month higher than at the beginning of the month. Global Markets reacted negatively to the Central Bank announcements in December 2022 but had a late surge, or Santa Rally, in the run up to the Christmas holidays. Sterling continued to decrease for the latter half of December against the dollar following the interest rate decisions, whereas the euro, after an initial decline, recovered to the end of December. Reaching the end of 2022, the US equity markets have had their worst year since the financial crash in 2008.

Elon Musk made an astonishing announcement that he would generate a survey amongst his 122 million followers as to whether he should step down as CEO of Twitter and pledged he would honour the decision of the results of the poll, be it negative or positive. A total of c.57% voted yes and Musk has since stated that he will step down once a suitable replacement is ready to take the reins.

On 20th December 2022, The Bank of Japan shocked markets ‘with a surprise tweak to its bond yield control that allows long-term interest rates to rise more, a move aimed at easing some of the costs of prolonged monetary stimulus’[ii]. Following the unexpected news, Japanese shares reacted negatively whilst both Japanese bond yields and the Yen increased. This caught many investors off guard given that analysts widely expected no change to yield curve control, especially in the run up to Governor Haruhiko Kuroda stepping down in April 2023. The decision was meant to ignite the dormant bond market. Hopefully, stability will be restored.

In the UK, manufacturing has seen a decline as there is less demand for new business. December saw the fifth consecutive month of contraction, as ‘British manufacturers are starting 2023 on the back foot, after they reported one of their sharpest falls in activity since the 2008-09 recession last month, reflecting a sharp fall in new orders and ongoing job cuts’[iii].  Unemployment rates have also risen in the UK as there are less vacancies available.

With China coming out of lockdown and ending their Zero-Policy Covid restrictions the country is seeing stocks improve in price on the basis that business, both domestic and international, will hopefully resume. Travel restrictions have been lifted allowing international travel from China but many countries including the US, the UK, Italy, India, Israel, Spain, Canada, South Korea, and France are all imposing the need to have a negative Covid Test and in Spain’s case, proof of vaccination. This is a positive step forward as ‘China may finally return to normal as the nation joins the rest of the world in learning to live with the virus’[iv]. There is still a long road to recovery ahead for China, but Global Markets will benefit from the good news and the new opportunities it will present.

Overall, December has still been slightly volatile for Global Markets but did not experience too many significant market shocks. Brent Crude continues to trade below $85 having dipped to a low of c.$76.10. The Federal Reserve has hinted at maintaining lower levels of interest rate hikes whilst the ECB stated there is still a large fight against inflation to go. Central Banks are continuing action to bring inflation down but at a calmer pace. The re-opening of China brings positive news to Global Markets. Japan has made a surprise move in its control of bond yields causing a shock. Bond yields have increased since the start of the month following the interest rate decision release.

[i] www.reuters.com/markets/europe/ecb-slow-rate-hikes-lay-out-plans-drain-cash-2022-12-14/

[ii] https://www.reuters.com/markets/rates-bonds/japan-set-keep-ultra-low-rates-doubts-over-yield-cap-grow-2022-12-19/

[iii] www.reuters.com/markets/europe/uk-manufacturing-ends-2022-low-orders-shrink-pmi-2023-01-03/#:~:text=LONDON%2C%20Jan%203%20(Reuters),orders%20and%20ongoing%20job%20cuts.

[iv] https://edition.cnn.com/2023/01/02/china/china-2023-lookahead-intl-hnk-mic/index.html

End of Year Investment Review: In Search of Optimism

by Adam Jones

As 2022 draws to a close we wanted to briefly highlight the exceptional uncertainty in investment markets as we head into 2023. We retain a cautious stance in portfolios overall but also see compelling arguments as to why things might turn out to be far less gloomy than seems widely expected.

Despite global PMI’s stabilising but still being in contractionary territory in November, December ISM Services data pointed to a very robust US consumer, whose confidence in spending has apparently yet to be curtailed by tighter monetary policy. Except for housing there appear few signs of restraint in broader US activity, giving rise to suggestions that the lag in monetary policy effectiveness may be longer than originally thought (and may not be evident until the end of H1’23). Recent declines in both oil prices and headline inflation data might also provide additional support for ongoing strength in consumption trends.

Source: Hottinger Investment Management / Refinitiv Datastream


In China, zero-covid policies have weighed on economic sentiment so much that recent street protests have led to a relaxation in policy that saw the Hang Seng index in Hong Kong become the strongest performing equity market in November, although most of these gains have since been erased given the recent uptick in new cases. On the economic front, one of the metrics we follow closely is known as the ‘credit impulse’ which simply measures the growth in new credit being provided to an economy relative to its GDP. In China the credit impulse has risen materially over the past few months and has historically led expansions in the global monetary base as defined by M2 (a measure of money supply which includes both cash deposits and instruments which are easily convertible into cash). While we do not consider ourselves to be explicit monetarists, it is interesting to note that expansions in global M2 have themselves tended to lead many of the major business cycle indicators such as manufacturing and output.

Should inflation continue to dissipate as global economies stabilise, this dynamic could turn out to be very supportive for risk assets in general. In this scenario investors, whose perspectives are almost universally bearish according to some measures of sentiment, are potentially at risk in being under-allocated to global equities.

This is the period when strategists and economists publish their forecasts for 2023 and Absolute Strategy Research (one of Hottinger’s key research partners) are not alone in believing that core inflation in US and Europe will be below 3% by the end of next year. Supply chains have generally normalised, the tightness of the labour market has not led to a wage spiral, falling commodity prices, and falling housing costs all combine to create a disinflationary trend. Central banks tend to be slow to cut rates, preferring to see consistently worse data and we believe there is a possibility that there are demographic changes involving retiring baby-boomers that could keep the labour market tighter than expected and over a longer transition period.

Source: Hottinger Investment Management / Refinitiv Datastream


Looking at corporate bond markets we also note that despite US high yield credit outperforming investment grade credit this year (even while lower-rated credit spreads have doubled), overall spreads remain well below levels witnessed in prior periods of forthcoming recession. We believe part of the explanation for this dynamic is that many businesses took advantage of exceptionally low refinancing rates post-Covid in 2020 to lock in lower rates over longer time frames (and hence significantly extended the maturity profile of their debt). If this is the case, then it stands to reason that a tighter monetary policy environment is likely to exert less of an effect on the corporate sector than it may have done historically.

The counterargument to this more optimistic view of 2023 is that savings rates in the developed world have now fallen back to (and in some cases below) pre-Covid levels in many countries. When coupled with recent witnessed spikes in credit card spending data this suggests a growing need for consumers to supplement the cost of living through short term finance. This is not typically a sustainable trend over any reasonable period, and we speculate may be a contributing factor to the weakness in US November retail sales last week.

Source: Hottinger Investment Management / Refinitiv Datastream


So, while global equities may have rallied approximately 10% over the last 2 months our baseline view remains that this represents a bear market rally. Equity and credit markets appear unwilling to price a more recessionary earnings outlook and cyclical sectors have barely underperformed more defensive sectors. It is only government bond markets which strongly suggest a forthcoming recession, with the yield curve having now inverted by more than 70bps (that is to say that 2yr bond yields are now greater than 70bps lower than 10y yields). In our opinion there are inconsistencies in 2023 forecasting based on the idea that investors have no reliable evidence of the monetary policy lag that will likely catalyse recession.

At the crossroads there are several scenarios, ranging from a soft landing to long and variable monetary policy lags causing a deep recession in 2023. The distribution of potential outcomes remains exceptionally wide due to high levels of prevailing uncertainty. Indeed, the last time an inflationary environment required so decisive a tightening cycle as that we have recently witnessed was back in the early eighties. We would argue that the global economy has evolved markedly since then in terms of demographics, labour market structure, global trade, technology, information dissemination and the implementation of monetary policy itself (forward guidance as an example). Such comparisons are therefore difficult and potentially misleading.

We remain cautious at this point, with an asset mix in favour of quality over cyclical growth, a preference for strong balance sheets, high cash flow yields and low levels of gearing with an overweight position in cash and government fixed income, where rates have become attractive for the first time in many years. We believe that despite a level of prevailing pessimism the spectrum of potential outcomes may lead to increased volatility and swift market reactions that would make disengaging from markets in a meaningful way a risky strategy for the long-term investor.