by Tim Sharp
Global equities may have returned 3% in January but the “Magnificent 7” were flat as the fall-out from Deep Seek questioned the capex spend related to the development of Generative AI models. Markets were taken by surprise by the Deep Seek announcement that saw a Chinese-based generative AI model achieve comparable results to the latest OpenAI models using a much-reduced level of computing power, as well as older chips, and at a fraction of the cost. This may bring major AI-related capex spending forecasts into question, however, the Q4 earnings season still saw many Mega-Cap Tech companies confirm their forecast AI spend. Shortly after the announcement, OpenAI did question whether the training of the model had infringed their copyright, and uncertainty remains on the future demand for datacenters, power usage, and Nvidia’s dominance over chip makers such as AMD, Arm, and TSMC, as well as the possibility of it’s largest customers, such as Meta, Amazon, and OpenAI, creating in-house products to create competition and save costs.
The US “exceptionalism” story has been based upon a widening productivity gap between the US and other developed nations since the pandemic, based largely upon the technological advantages created from the development of AI. We see technological innovation as being critical in pushing US productivity. The ability of the US to maintain its advantage will probably rely on the innovation within AI continuing to accelerate or signs that its—-wider adoption into other sectors is also capable of driving productivity growth in the wider economy.
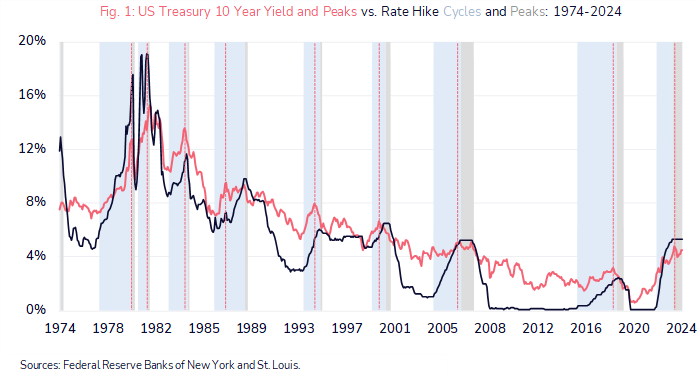
Fixed income benchmarks were broadly unchanged in January after the bear steepening events of December. A deeper look at the rising 10-year Treasury yields since September last year highlights the impact of the movement in the term premium on equity markets. Resilient economic data coupled with rising yields led to positive equity returns in Q424. However, when yields rose above 4.5% and economic expectations fell while the term premium expanded in December and January, equity returns were less positive. The change in the relationship between bond yields and equities may also have been impacted by Q424 earnings season where yield sensitive sectors, such as Energy, Banks and Insurers, seem more correlated to a move in yields than Technology, Healthcare and Media.
Absolute Strategy Research (ASR) Sentiment Indicators improved over January across most asset classes but most noticeably in European and UK equities, and Gold and Copper[i]. The Federal Reserve Banks of St Louis and Chicago published Financial Conditions Index was 3% looser in January to the 12th percentile, while real yields rose significantly. Key macro developments saw the manufacturing PMIs stronger than expected in the US, Europe, and UK, while services PMIs were weaker except in the UK. Within the Eurozone, we see differences in structure to that of the US aimed at protecting workers’ rights as shown by a higher level of collective bargaining, and union representation within the wider workforce. Worker protection may have created a less flexible workforce that may leave wage growth stronger by comparison during Q125. Stickier wage growth may well impact the ECB’s ability to execute monetary policy changes at a time when further stimulus may be appropriate for the wider economy. A 25bp cut from the ECB and a dovish hold from the Fed in January were largely as expected, while the fallout from a surprising rate hike by the Bank of Japan led to the underperformance of Japanese equities, and we have now seen a BOE cut of 25bps in early February. We believe the major developed economies seem to be on diverging paths at present which is best reflected in currency markets, and this is leading to pressures building for both monetary and fiscal policy decision-making as well as relative valuations for global financial assets.
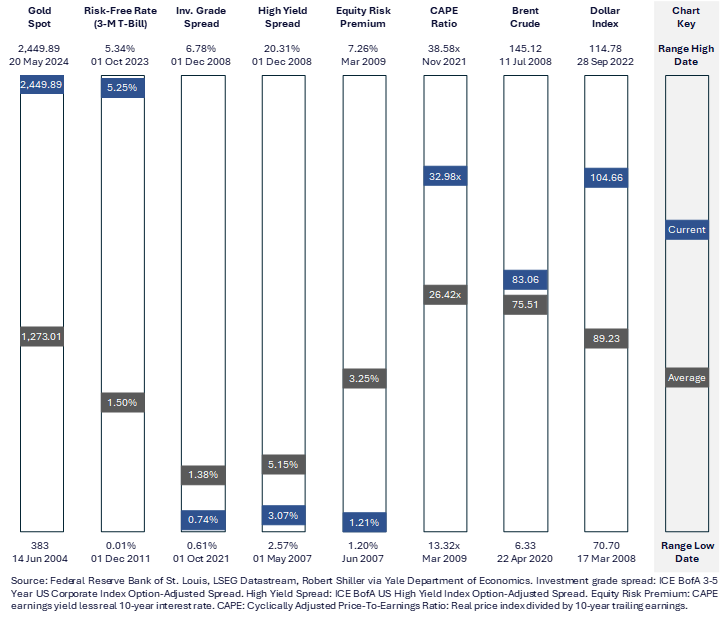
The 7% gain in gold in January while still mainly a consequence of central bank buying, most notably China and India, may also be sending a signal that investors are wary of a world where the number of active parties in global geo-political events is growing, and concerns over the level of indebtedness of developed countries and the effect this might have on policy. The recent 3-year US Treasury auction attracted demand from foreign investors as well as domestic interest at 4.3% although dealer interest was low, and with 33% of the US debt outstanding up for renewal in 2025 due to the level of 3-month T-Bill funding undertaken by the last administration, it will be interesting to see the level for appetite in the longer maturities from concerned investors.
The Trump agenda has seen many executive orders signed, the most significant related to climate change, however many of the tariff initiatives have been used as bargaining tools and rolled back from initiation. The future of other policies such as tax reforms and de-regulation remains unclear to us, but risk assets seem to have accepted the policy uncertainty, capex intentions have accelerated, and there are signs in the manufacturing ISMs that the economy is gaining momentum. The expected broadening out of returns from the continuing strong economic outlook, may see the momentum from the Trump trade for small and mid-cap equities within the S&P600 continue where 12-month forward EPS growth are estimated at 20.8% for the S&P600 versus. 14% for the S&P500i.
After an encouraging end to 2024, Chinese equities have plateaued without further actions by the administration to stimulate growth, and fears over the pace of a new trade war with the US. Following the US decision to impose a 10% tax on all Chinese imports, China retaliated with a 15% border tax on US coal and LNG products as well as a 10% tariff on American crude oil, agricultural machinery, and large engine cars. China has also imposed export controls on 25 rare metals used in electrical products and military equipment. These moves are probably only the opening negotiations in what could be a more volatile trade war than previously experienced because both countries most likely feel they have strong positions. China has moved large parts of its final-stage assembly to other developing countries as well as becoming a significant global exporter of automobiles. Although the level of trade between the US and China has remained reasonably steady at approximately $580bn, China has diversified its trade and investments and seems to have increased its technological capabilities since 2018-2020. The leaders do not seem to be in a hurry to meet currently, but the outcomes of US tariffs are likely to have an impact on global growth and the flow of goods and services around the global economy.
In summary, despite the adjustments to rates probably being higher for longer, the outlook still appears favourable for equities, and we expect the broadening out of earnings growth to take over as the driver of valuations. Although the US has stronger momentum, there are several relative valuations that have become stretched not least in Europe which led to outperformance in January as Mega-Cap Tech faltered. For this to continue, Europe will probably need to find further catalysts such as an improving macro background, positive progress for Ukraine, a stabilisation in the China outlook, and a weaker dollar, as well as a favourable outcome in its tariff negotiations with the US.
[i] Zara Ward-Murphy _ ASR Investment Committee Briefing _ February 3, 2025