

by Rob Cloete
Regional monetary policy, prospects for future easing and the potential for divergent interest rate paths continue to dominate headlines and influence investor positioning. The Eurozone’s widely anticipated June rate cut unusually stole the march on the Federal Reserve, with policymakers willing to risk the adverse ramifications of a strong Dollar for the sake of averting a recession amidst lacklustre economic data. As attention turns stateside, the future path remains unclear, and further complicated by the upcoming elections and inclination for the Federal Reserve to remain unbiased. Meanwhile, the ‘risk on’ (short volatility) environment that’s been in place largely uninterrupted since October 2022 has contributed to lofty valuations across both equities and credit. This note seeks to determine whether hopes pinned on future easing to further drive valuations may be misplaced.
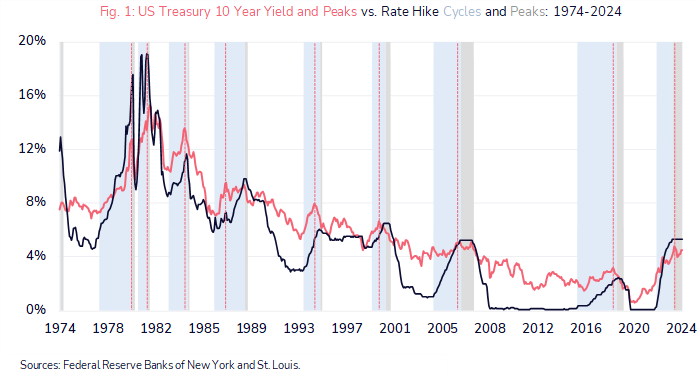
Figure 1 above reflects the relationship between the nominal 10-year treasury yield (coral line) and the policy rate. The vertical dotted lines illustrate that, the market being a future discounting mechanism, treasury yields typically peak during rate hike cycles (light blue bars) and prior to cycle peaks (grey bars). The Federal Reserve paused hikes in the current cycle in August 2023. Should the current level prove to be the cycle peak, then the ‘top may be in’ for treasury yields in this cycle. We remain constructive on duration and are positioned accordingly, not least due to the asymmetric prospective returns from convexity. A rate cut of 100 bps would result in a 12% appreciation in the 10-year treasury, while an equivalent rate rise would cause just a 3% decline. Elsewhere, while nominal yields on credit are optically attractive, with the US High Yield Index for example offering a yield to maturity approaching 700 bps, the spread over government paper is negligible at around 300bps (and near the bottom of the 300-900bps range since 2010 and some 200bps below the average over that period). Refinancing costs have declined, and the maturity schedule provides flexibility, but risk-adjusted compensation remains inadequate.
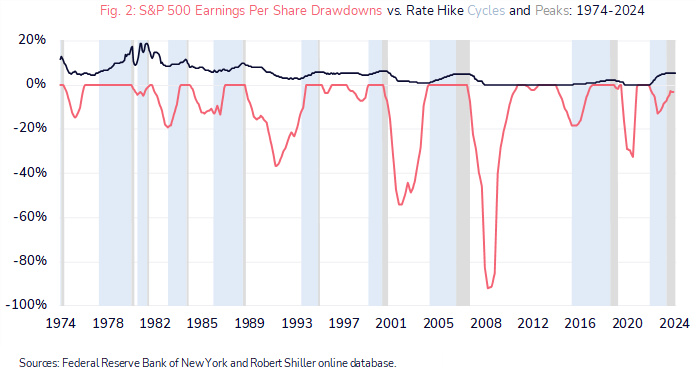
Figure 2 below shows that, contrary to popular opinion, a rate cutting environment may not support equities: rate cutting cycles have historically regularly preceded earnings recessions. The coral line reflects the S&P 500 earnings per share declines that have typically occurred during rate cycle ‘pauses’ (grey bars) and before rate cuts begin. With equity valuations currently elevated (a forward PE ratio of 21x, from which subsequent annualised ten-year returns have been paltry, ranging from 0% to 5% in data going back to 1988), the stakes are high. With multiples having expanded to the point that the risk premium over ‘safer’ investment grade credit is now negative, we maintain our view that earnings will need to do the heavy lifting if major equity indices are to continue their upward trajectory. On this front, there is cause for optimism, with FactSet consensus forecasts anticipating double digit earnings growth in each of the next two years (11% in 2024 and 14% in 20251). While constructive and selective with our equity allocation, we remain cautious, and conscious that stock markets have tended to peak in anticipation of rate cutting cycles (and not during them). Further, equity indices decline in advance of earnings declines, so we remain attuned to changes in earnings expectations as a warning signal that the prevailing ‘risk on’ environment – particularly in the more momentum driven pockets – may be about to turn.
Going forward, while wary of index levels and valuations, we continue to apply our bottom-up approach and valuation discipline to equity selection, exploiting the risk budget that safer allocations elsewhere (to government bonds, gold, and diversifying alternative funds exposures) permits us.
Sources:
1 Butters, J. (21 June 2024). FactSet Earnings Insight. [online].
Available at: https://www.factset.com/earningsinsight
2 Federal Reserve Bank of St. Louis. ICE BofA US High Yield Index Option-Adjusted Spread. [online].
Available at: https://fred.stlouisfed.org/series/BAMLH0A0HYM2
Our investment strategy committee, which consists of seasoned strategists and investment managers, meets regularly to review asset allocation, geographical spread, sector preferences and key global market drivers and our economist produces research and views on global economies which complement this process.
Our quarterly report presents our views on the world economic outlook and equity, fixed income and foreign exchange markets. Please click the link to download.