

by Alex Hulkhory
Since the ‘Great Financial Crisis’ – and arguably for a lot longer – monetary policy has understandably dominated the attention of financial markets. However, for the avid readers of our investment commentary of late, you will have noticed that our thinking has increasingly been focused on fiscal policy: Our writing, much like many economies globally, is in an era of fiscal dominance!
The What
As a whistlestop introduction, when assessing the macroeconomic environment, policy decisions have an outsized impact. Broadly, this can be split into two camps. Fiscal policy, which relates to the decisions governments make over taxation and spending, and monetary policy, which relates to the job done by central banks in setting interest rates. Importantly, central banks are independent of government.
Looking at the current situation in the US highlights the importance of this independence. The Federal Reserve – the US Central bank – has a dual mandate, comprising (1) Full employment and (2) Stable prices. As the last few years have shown, simultaneously maintaining stable prices and taming inflation is no mean feat.
However, we are increasingly seeing signs that the fiscal situation that many economies globally are facing is an overwhelming force. At best, undermining the effectiveness of monetary policy and, at worst, completely impairing it. Enter fiscal dominance.
The How
Historically, interest rates have been the (highly effective) lever to heat or cool the economy. As was seen during the outset of the COVID19 pandemic, in periods where the economy is slowing, interest rates are lowered to boost demand and support the economy. The opposite is true for raising rates in an overheating economy. So the theory goes, at least….
As well as giving an excellent steer on the path of the economy, the trajectory of interest rates also has a significant bearing on asset prices. The interest rate set by central banks – after a studious review of inflation and the economy – also acts as the de facto reference point when assessing risk. Assuming market participants are rational, when interest rates rise, they demand additional compensation. The value of investments can go up as well as down. To take on the inherent risks associated with investing, understandably there needs to be a commensurate reward available.
Turning our focus to fiscal policy, traditional Keynesian economic theory is not too dissimilar to the view taken with monetary policy: The approach being that during periods of economic weakness governments would run fiscal deficits – spending more than they receive in tax receipts – to support the economy and likewise running surpluses during periods of strength, to balance the books.
It is for this reason markets didn’t bat an eyelid during the heightened COVID era deficits – including a peacetime record of 15% of GDP in 20/21 for the UK[i] – but bond markets baulked at the idea of unfunded tax cuts proposed Liz Truss during a period when the worst of the crisis was over. Ultimately, borrowers need to demonstrate that they are a credible counterparty or face the risk that borrowing costs can rise meaningfully.
Running deficits adds to the debt burden of a country. Government debt is not inherently bad, and as economies grow, it is reasonable for debt levels to rise. The key focus of markets is debt to GDP – in simple terms, the level of debt relative to the size of the economy. If a country is running a deficit of 5% per year, but growing at 6% over time, the debt dynamics will be improving.
The secret to a long & happy life (for individuals): live within your means
The challenging predicament we find ourselves in today is that many governments are running record deficits, but without the economic growth to show for it. Habitually spending more than your income is ill-advised for individuals. However, this age-old advice does not seem to apply to the US government, which has run fiscal deficits in 41 out of the last 45 years, with deficits of over a trillion in each of the last five years[ii], As a result, US debt has burgeoned to over $36.65tr[iii].
Why now?
Given that this has been a multi-decade story, you may reasonably ask why this matters now? For the past thirty years, commentary has highlighted concerning levels of debt, and yet financial markets have been resilient over the long term. Whilst we are not alarmist about the current situation, it has begun to have a noticeable macroeconomic impact.
As the chart below[iv] highlights, since 2016, US debt to GDP has exceeded 100%, and following the COVID era deficits, exceeded 120% at the end of 2024. Crossing this threshold has (in our opinion) been the important development in this story. As a further point, this is a theme that is becoming further entrenched: President Trump’s One Big Beautiful Bill Act (OBBBA) is projected to add a further $3tr to the deficit over the next decade[v].
Figure 1: Total Public Debt as a Percentage of Gross Domestic Product
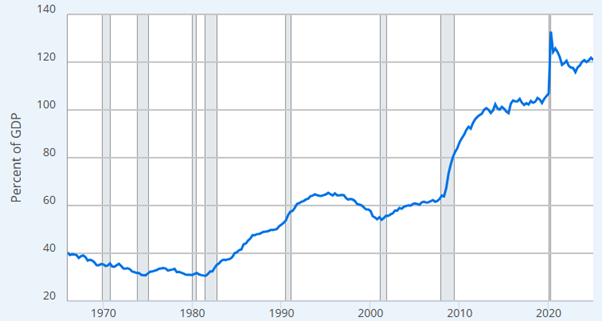
Source: Federal Reserve Bank of St. Louis
Evolving dynamics
The significance of this change has been particularly evident in recent years as governments globally embarked on one of the fastest and most aggressive rate hiking cycles in history, raising interest rates to maintain stable prices and tame inflation.
As interest rates rose, so too did the costs of servicing the sizeable debt burden. As a result, attempts by central banks to tighten monetary conditions have been undermined by escalating fiscal stimulus. This shift in debt dynamics suggests we are entering an era of fiscal dominance, whereby the effectiveness of monetary policy as a brake to cool an overheating economy is impaired. The latest core inflation data in the US came in at 3.1% in July[vi] highlighting the challenge of getting to the Fed’s stated 2% target.
What does this mean for the economy?
Considering the broader investment implications of this paradigm shift, inflation and economic growth may ultimately continue to surprise to the upside (while noting the declining marginal productivity of debt), with downturns more closely mirroring the inflationary impulses that plagued the 1970s, rather than the deflationary episodes that had become more commonplace post GFC.
What does this mean for portfolios?
This is also likely to have wider ranging implications for asset allocation with evidence suggesting that the traditional relationship of negatively correlated equities and bonds tends to break down at higher levels of inflation[vii]. This backdrop is likely to favour real assets and commodities, with gold a notable beneficiary. This supported the strategy committee’s decision to increase our gold allocation earlier in the year.
Concluding thoughts
Invariably, markets find new weird and wonderful ways to surprise us! Whilst the above paints a view of a more inflationary new world order, this is an ever-evolving situation with many possible deflationary forces. Some known. The potentially revolutionary impact of AI. The evolving property crisis in China. Some unknown. However, we remain confident that we are well placed to navigate this environment through a flexible and diversified approach.
[ii] https://fred.stlouisfed.org/series/FYFSD
[iii] https://fiscaldata.treasury.gov/datasets/debt-to-the-penny/debt-to-the-penny
[iv] https://fred.stlouisfed.org/series/GFDEGDQ188S
[v] https://budgetlab.yale.edu/research/financial-cost-senate-passed-budget-bill
[vi] https://tradingeconomics.com/united-states/core-inflation-rate
[vii] https://www.morningstar.com/portfolios/what-higher-inflation-means-stock-bond-correlations
Our investment strategy committee, which consists of seasoned strategists and investment managers, meets regularly to review asset allocation, geographical spread, sector preferences and key global market drivers and our economist produces research and views on global economies which complement this process.
Our quarterly report presents our views on the world economic outlook and equity, fixed income and foreign exchange markets. Please click the link to download.